29
/
en
AIzaSyAYiBZKx7MnpbEhh9jyipgxe19OcubqV5w
April 1, 2024
226379
Portugal
PRT
true
2
1
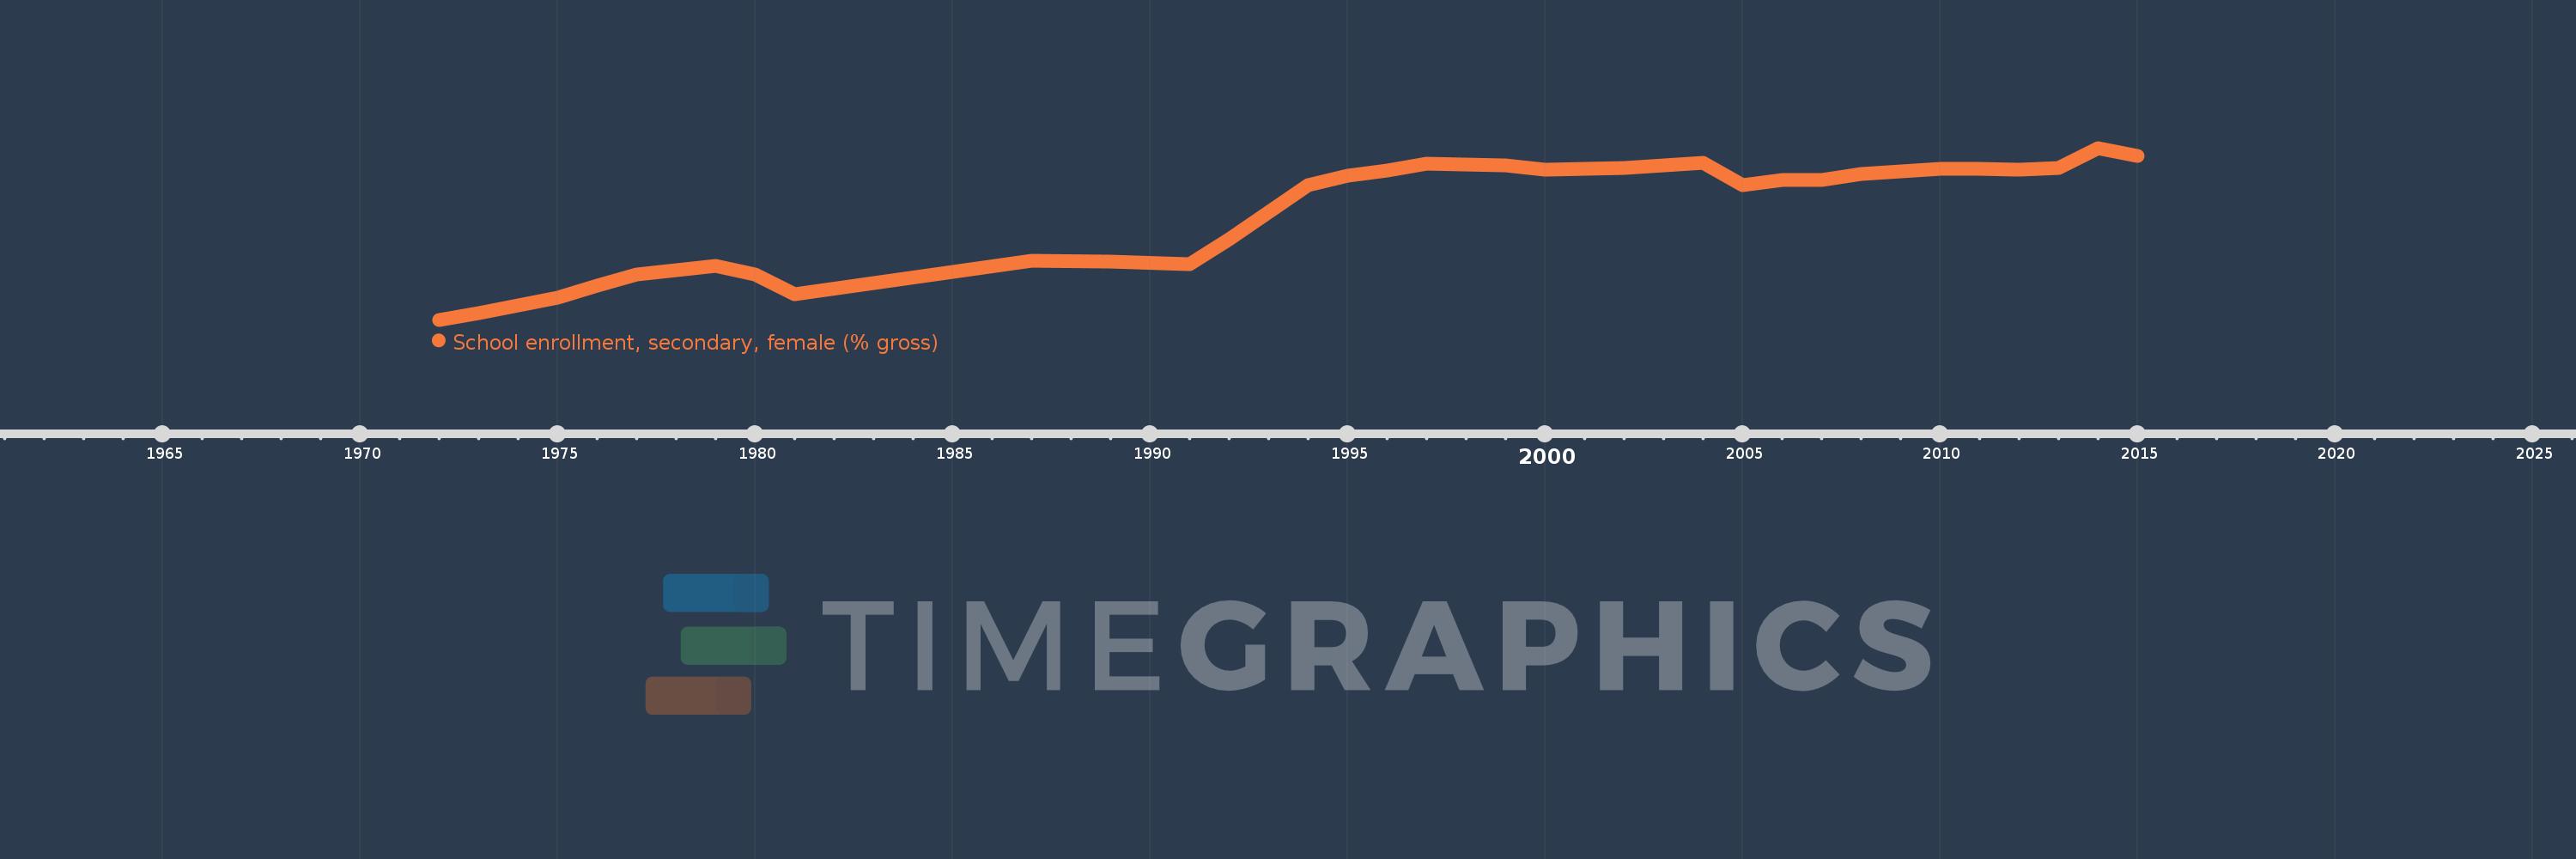
School enrollment, secondary, female (% gross)
2015,2014,2013,2012,2011,2010,2009,2008,2007,2006,2005,2004,2003,2002,2001,2000,1999,1997,1996,1995,1994,1992,1991,1989,1987,1981,1980,1979,1978,1977,1976,1975,1974,1973,1972
This statistics in other country:
AfghanistanAlbaniaAlgeriaAndorraAngolaAntigua and BarbudaArab WorldArgentinaArmeniaArubaAustraliaAustriaAzerbaijanBahamas, TheBahrainBangladeshBarbadosBelarusBelgiumBelizeBeninBermudaBhutanBoliviaBosnia and HerzegovinaBotswanaBrazilBrunei DarussalamBulgariaBurkina FasoBurundiCabo VerdeCambodiaCameroonCanadaCaribbean small statesCentral African RepublicCentral Europe and the BalticsChadChileChinaColombiaComorosCongo, Dem. Rep.Congo, Rep.Costa RicaCote d'IvoireCroatiaCubaCuracaoCyprusCzech RepublicDenmarkDjiboutiDominicaDominican RepublicEarly-demographic dividendEast Asia & PacificEast Asia & Pacific (excluding high income)East Asia & Pacific (IDA & IBRD countries)EcuadorEgypt, Arab Rep.El SalvadorEquatorial GuineaEritreaEstoniaEthiopiaEuro areaEurope & Central AsiaEurope & Central Asia (excluding high income)Europe & Central Asia (IDA & IBRD countries)European UnionFijiFinlandFragile and conflict affected situationsFranceGabonGambia, TheGeorgiaGermanyGhanaGreeceGrenadaGuatemalaGuineaGuinea-BissauGuyanaHeavily indebted poor countries (HIPC)High incomeHondurasHong Kong SAR, ChinaHungaryIBRD onlyIcelandIDA & IBRD totalIDA blendIDA onlyIDA totalIndiaIndonesiaIran, Islamic Rep.IraqIrelandIsraelItalyJamaicaJapanJordanKazakhstanKenyaKiribatiKorea, Dem. People’s Rep.Korea, Rep.KuwaitKyrgyz RepublicLao PDRLate-demographic dividendLatin America & Caribbean Latin America & Caribbean (excluding high income)Latin America & the Caribbean (IDA & IBRD countries)LatviaLeast developed countries: UN classificationLebanonLesothoLiberiaLibyaLiechtensteinLithuaniaLow & middle incomeLow incomeLower middle incomeLuxembourgMacao SAR, ChinaMacedonia, FYRMadagascarMalawiMaldivesMaliMaltaMarshall IslandsMauritaniaMauritiusMexicoMicronesia, Fed. Sts.Middle East & North AfricaMiddle East & North Africa (excluding high income)Middle East & North Africa (IDA & IBRD countries)Middle incomeMoldovaMongoliaMontenegroMoroccoMozambiqueMyanmarNamibiaNauruNepalNetherlandsNew ZealandNicaraguaNigerNigeriaNorth AmericaNorwayOECD membersOmanOther small statesPacific island small statesPakistanPalauPanamaPapua New GuineaParaguayPeruPhilippinesPolandPortugalPost-demographic dividendPre-demographic dividendPuerto RicoQatarRomaniaRussian FederationRwandaSamoaSan MarinoSao Tome and PrincipeSaudi ArabiaSenegalSerbiaSeychellesSierra LeoneSlovak RepublicSloveniaSmall statesSolomon IslandsSomaliaSouth AfricaSouth AsiaSouth Asia (IDA & IBRD)SpainSri LankaSt. Kitts and NevisSt. LuciaSt. Vincent and the GrenadinesSub-Saharan Africa Sub-Saharan Africa (excluding high income)Sub-Saharan Africa (IDA & IBRD countries)SudanSurinameSwazilandSwedenSwitzerlandSyrian Arab RepublicTajikistanTanzaniaThailandTimor-LesteTogoTongaTrinidad and TobagoTunisiaTurkeyTurkmenistanTuvaluUgandaUkraineUnited Arab EmiratesUnited KingdomUnited StatesUpper middle incomeUruguayUzbekistanVanuatuVenezuela, RBVietnamWest Bank and GazaWorldYemen, Rep.ZambiaZimbabwe Timeline:
This timeline shows a graph from 1972 to 2015 of Portugal. No data until 1971. Number of actual observations by date: 35.
Source name:
World Development Indicators
Source organization:
United Nations Educational, Scientific, and Cultural Organization (UNESCO) Institute for Statistics.
Categories, topics:
Education, Gender
Last updated:
apr 23, 2017
Indicators value changes by year
Minimum:
32.485
jan 1, 1972
Maximum:
118.793
jan 1, 2014
At the date of observation
Value
Absolute change
Change from previous value
jan 1, 1972
32.485
+32.485
0.0%
jan 1, 1973
35.903
+3.418
10.52%
jan 1, 1974
39.552
+3.649
10.16%
jan 1, 1975
43.586
+4.034
10.2%
jan 1, 1976
49.639
+6.053
13.89%
jan 1, 1977
55.249
+5.61
11.3%
jan 1, 1978
57.324
+2.074
3.75%
jan 1, 1979
59.354
+2.03
3.54%
jan 1, 1980
55.156
-4.197
-7.07%
jan 1, 1981
45.318
-9.838
-17.84%
jan 1, 1987
62.178
+16.86
37.2%
jan 1, 1989
61.543
-0.635
-1.02%
jan 1, 1991
60.34
-1.203
-1.95%
jan 1, 1992
72.761
+12.42
20.58%
jan 1, 1994
100.32
+27.56
37.88%
jan 1, 1995
104.663
+4.343
4.33%
jan 1, 1996
107.288
+2.625
2.51%
jan 1, 1997
110.965
+3.677
3.43%
jan 1, 1999
110.009
-0.956
-0.86%
jan 1, 2000
107.793
-2.216
-2.01%
jan 1, 2001
108.275
+0.482
0.45%
jan 1, 2002
108.865
+0.59
0.54%
jan 1, 2003
110.049
+1.184
1.09%
jan 1, 2004
111.299
+1.251
1.14%
jan 1, 2005
100.043
-11.256
-10.11%
jan 1, 2006
102.777
+2.734
2.73%
jan 1, 2007
102.85
+0.073
0.07%
jan 1, 2008
105.796
+2.946
2.86%
jan 1, 2009
106.812
+1.016
0.96%
jan 1, 2010
108.341
+1.529
1.43%
jan 1, 2011
108.434
+0.093
0.09%
jan 1, 2012
107.797
-0.636
-0.59%
jan 1, 2013
108.868
+1.07
0.99%
jan 1, 2014
118.793
+9.925
9.12%
jan 1, 2015
114.966
-3.826
-3.22%
Ranking of countries by current statistics by years


Comments: