29
/
en
AIzaSyAYiBZKx7MnpbEhh9jyipgxe19OcubqV5w
April 1, 2024
33844
European Union
EUU
false
2
1
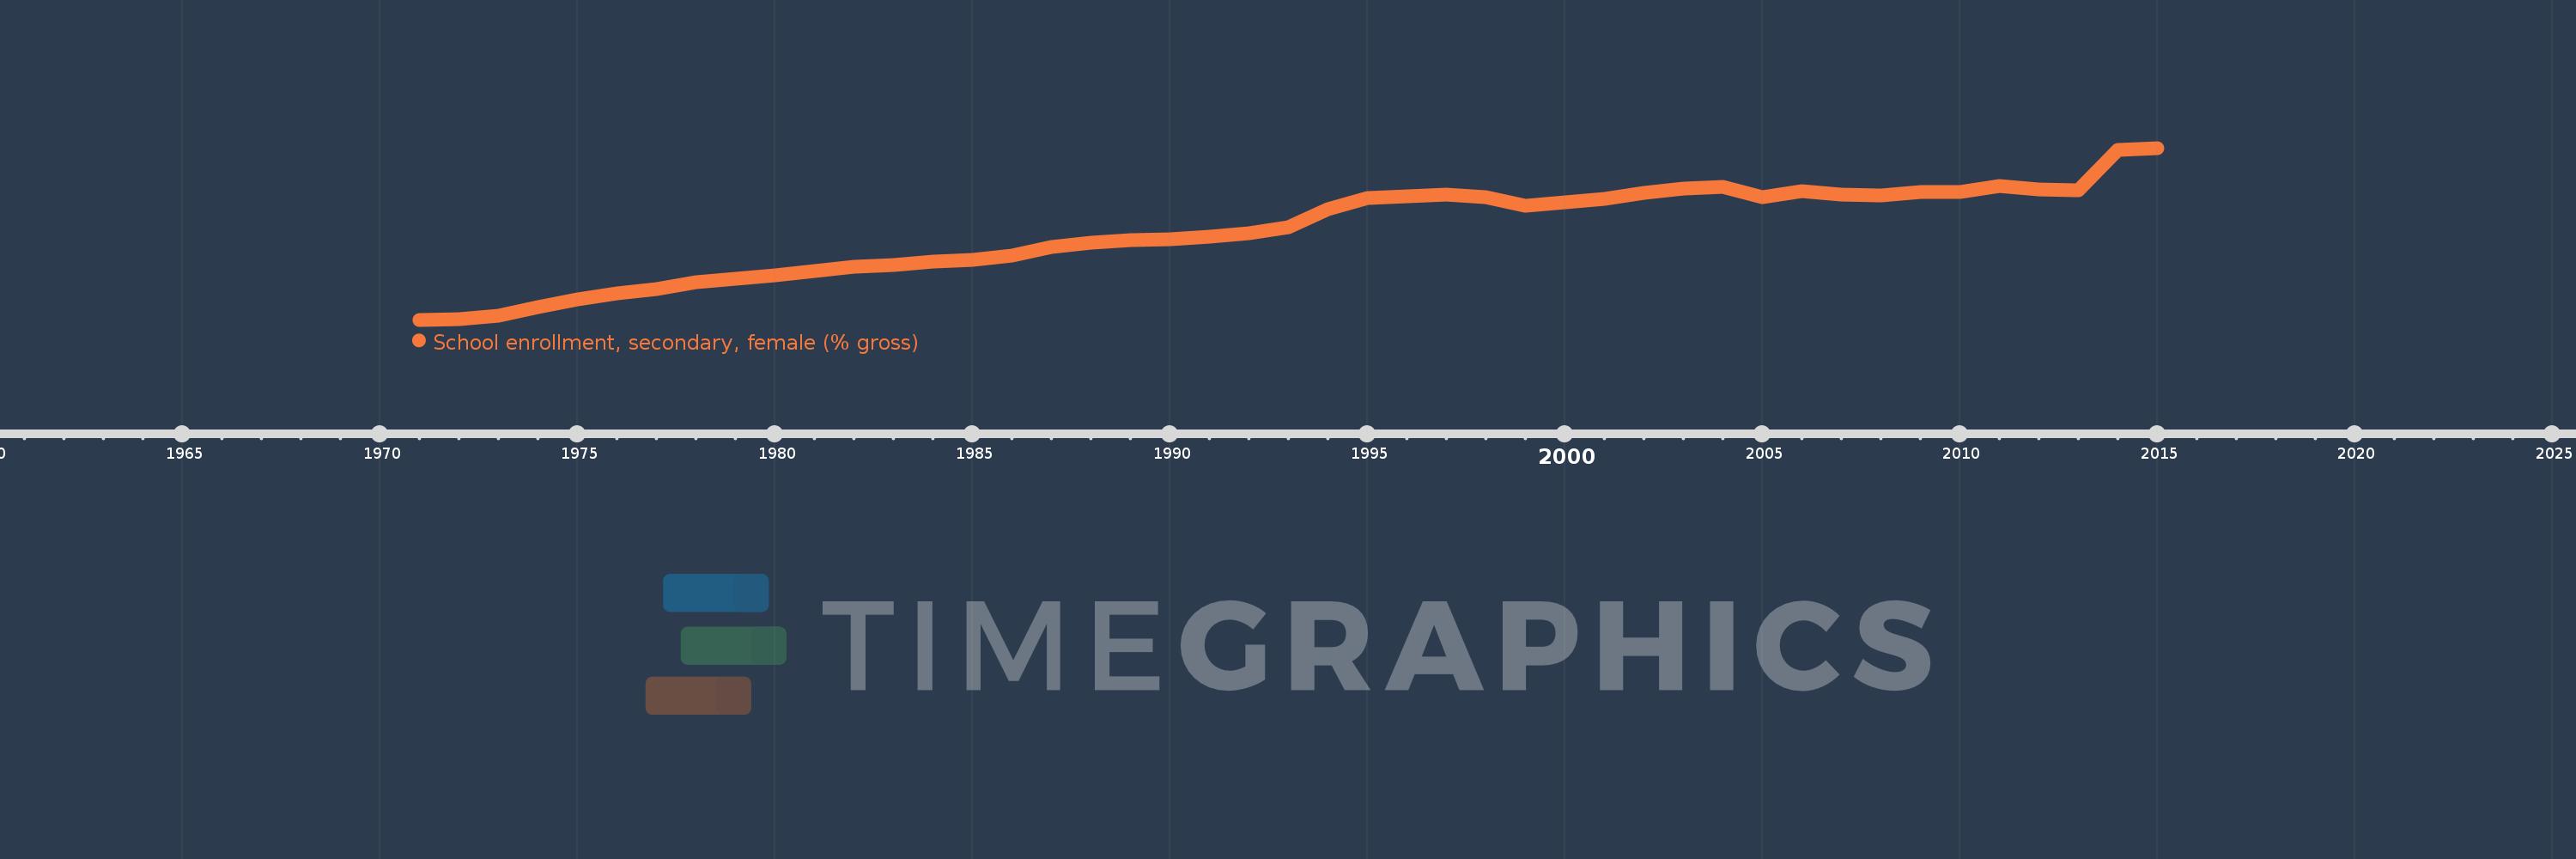
School enrollment, secondary, female (% gross)
2015,2014,2013,2012,2011,2010,2009,2008,2007,2006,2005,2004,2003,2002,2001,2000,1999,1998,1997,1996,1995,1994,1993,1992,1991,1990,1989,1988,1987,1986,1985,1984,1983,1982,1981,1980,1979,1978,1977,1976,1975,1974,1973,1972,1971
This statistics in other country:
AfghanistanAlbaniaAlgeriaAndorraAngolaAntigua and BarbudaArab WorldArgentinaArmeniaArubaAustraliaAustriaAzerbaijanBahamas, TheBahrainBangladeshBarbadosBelarusBelgiumBelizeBeninBermudaBhutanBoliviaBosnia and HerzegovinaBotswanaBrazilBrunei DarussalamBulgariaBurkina FasoBurundiCabo VerdeCambodiaCameroonCanadaCaribbean small statesCentral African RepublicCentral Europe and the BalticsChadChileChinaColombiaComorosCongo, Dem. Rep.Congo, Rep.Costa RicaCote d'IvoireCroatiaCubaCuracaoCyprusCzech RepublicDenmarkDjiboutiDominicaDominican RepublicEarly-demographic dividendEast Asia & PacificEast Asia & Pacific (excluding high income)East Asia & Pacific (IDA & IBRD countries)EcuadorEgypt, Arab Rep.El SalvadorEquatorial GuineaEritreaEstoniaEthiopiaEuro areaEurope & Central AsiaEurope & Central Asia (excluding high income)Europe & Central Asia (IDA & IBRD countries)European UnionFijiFinlandFragile and conflict affected situationsFranceGabonGambia, TheGeorgiaGermanyGhanaGreeceGrenadaGuatemalaGuineaGuinea-BissauGuyanaHeavily indebted poor countries (HIPC)High incomeHondurasHong Kong SAR, ChinaHungaryIBRD onlyIcelandIDA & IBRD totalIDA blendIDA onlyIDA totalIndiaIndonesiaIran, Islamic Rep.IraqIrelandIsraelItalyJamaicaJapanJordanKazakhstanKenyaKiribatiKorea, Dem. People’s Rep.Korea, Rep.KuwaitKyrgyz RepublicLao PDRLate-demographic dividendLatin America & Caribbean Latin America & Caribbean (excluding high income)Latin America & the Caribbean (IDA & IBRD countries)LatviaLeast developed countries: UN classificationLebanonLesothoLiberiaLibyaLiechtensteinLithuaniaLow & middle incomeLow incomeLower middle incomeLuxembourgMacao SAR, ChinaMacedonia, FYRMadagascarMalawiMaldivesMaliMaltaMarshall IslandsMauritaniaMauritiusMexicoMicronesia, Fed. Sts.Middle East & North AfricaMiddle East & North Africa (excluding high income)Middle East & North Africa (IDA & IBRD countries)Middle incomeMoldovaMongoliaMontenegroMoroccoMozambiqueMyanmarNamibiaNauruNepalNetherlandsNew ZealandNicaraguaNigerNigeriaNorth AmericaNorwayOECD membersOmanOther small statesPacific island small statesPakistanPalauPanamaPapua New GuineaParaguayPeruPhilippinesPolandPortugalPost-demographic dividendPre-demographic dividendPuerto RicoQatarRomaniaRussian FederationRwandaSamoaSan MarinoSao Tome and PrincipeSaudi ArabiaSenegalSerbiaSeychellesSierra LeoneSlovak RepublicSloveniaSmall statesSolomon IslandsSomaliaSouth AfricaSouth AsiaSouth Asia (IDA & IBRD)SpainSri LankaSt. Kitts and NevisSt. LuciaSt. Vincent and the GrenadinesSub-Saharan Africa Sub-Saharan Africa (excluding high income)Sub-Saharan Africa (IDA & IBRD countries)SudanSurinameSwazilandSwedenSwitzerlandSyrian Arab RepublicTajikistanTanzaniaThailandTimor-LesteTogoTongaTrinidad and TobagoTunisiaTurkeyTurkmenistanTuvaluUgandaUkraineUnited Arab EmiratesUnited KingdomUnited StatesUpper middle incomeUruguayUzbekistanVanuatuVenezuela, RBVietnamWest Bank and GazaWorldYemen, Rep.ZambiaZimbabwe Timeline:
This timeline shows a graph from 1971 to 2015 of European Union. No data until 1970. Number of actual observations by date: 45.
Source name:
World Development Indicators
Source organization:
United Nations Educational, Scientific, and Cultural Organization (UNESCO) Institute for Statistics.
Categories, topics:
Education, Gender
Last updated:
apr 23, 2017
Indicators value changes by year
Minimum:
75.594
jan 1, 1971
Maximum:
112.694
jan 1, 2015
At the date of observation
Value
Absolute change
Change from previous value
jan 1, 1971
75.594
+75.594
0.0%
jan 1, 1972
75.644
+0.05
0.07%
jan 1, 1973
76.486
+0.842
1.11%
jan 1, 1974
78.349
+1.863
2.44%
jan 1, 1975
79.91
+1.562
1.99%
jan 1, 1976
81.258
+1.348
1.69%
jan 1, 1977
82.29
+1.032
1.27%
jan 1, 1978
83.647
+1.357
1.65%
jan 1, 1979
84.478
+0.831
0.99%
jan 1, 1980
85.226
+0.748
0.89%
jan 1, 1981
86.065
+0.839
0.98%
jan 1, 1982
87.028
+0.963
1.12%
jan 1, 1983
87.333
+0.305
0.35%
jan 1, 1984
88.244
+0.911
1.04%
jan 1, 1985
88.583
+0.338
0.38%
jan 1, 1986
89.433
+0.85
0.96%
jan 1, 1987
91.336
+1.903
2.13%
jan 1, 1988
92.288
+0.952
1.04%
jan 1, 1989
92.704
+0.416
0.45%
jan 1, 1990
93.068
+0.364
0.39%
jan 1, 1991
93.503
+0.435
0.47%
jan 1, 1992
94.233
+0.73
0.78%
jan 1, 1993
95.579
+1.346
1.43%
jan 1, 1994
99.468
+3.888
4.07%
jan 1, 1995
101.811
+2.344
2.36%
jan 1, 1996
102.25
+0.439
0.43%
jan 1, 1997
102.631
+0.381
0.37%
jan 1, 1998
102.078
-0.552
-0.54%
jan 1, 1999
100.134
-1.945
-1.91%
jan 1, 2000
100.902
+0.768
0.77%
jan 1, 2001
101.634
+0.732
0.73%
jan 1, 2002
102.905
+1.271
1.25%
jan 1, 2003
103.834
+0.929
0.9%
jan 1, 2004
104.211
+0.377
0.36%
jan 1, 2005
101.981
-2.229
-2.14%
jan 1, 2006
103.298
+1.317
1.29%
jan 1, 2007
102.54
-0.758
-0.73%
jan 1, 2008
102.47
-0.07
-0.07%
jan 1, 2009
103.132
+0.662
0.65%
jan 1, 2010
103.188
+0.056
0.05%
jan 1, 2011
104.427
+1.239
1.2%
jan 1, 2012
103.654
-0.772
-0.74%
jan 1, 2013
103.579
-0.076
-0.07%
jan 1, 2014
112.342
+8.763
8.46%
jan 1, 2015
112.694
+0.353
0.31%
Ranking of countries by current statistics by years


Comments: