29
/
en
AIzaSyAYiBZKx7MnpbEhh9jyipgxe19OcubqV5w
April 1, 2024
270041
Turkey
TUR
true
2
1
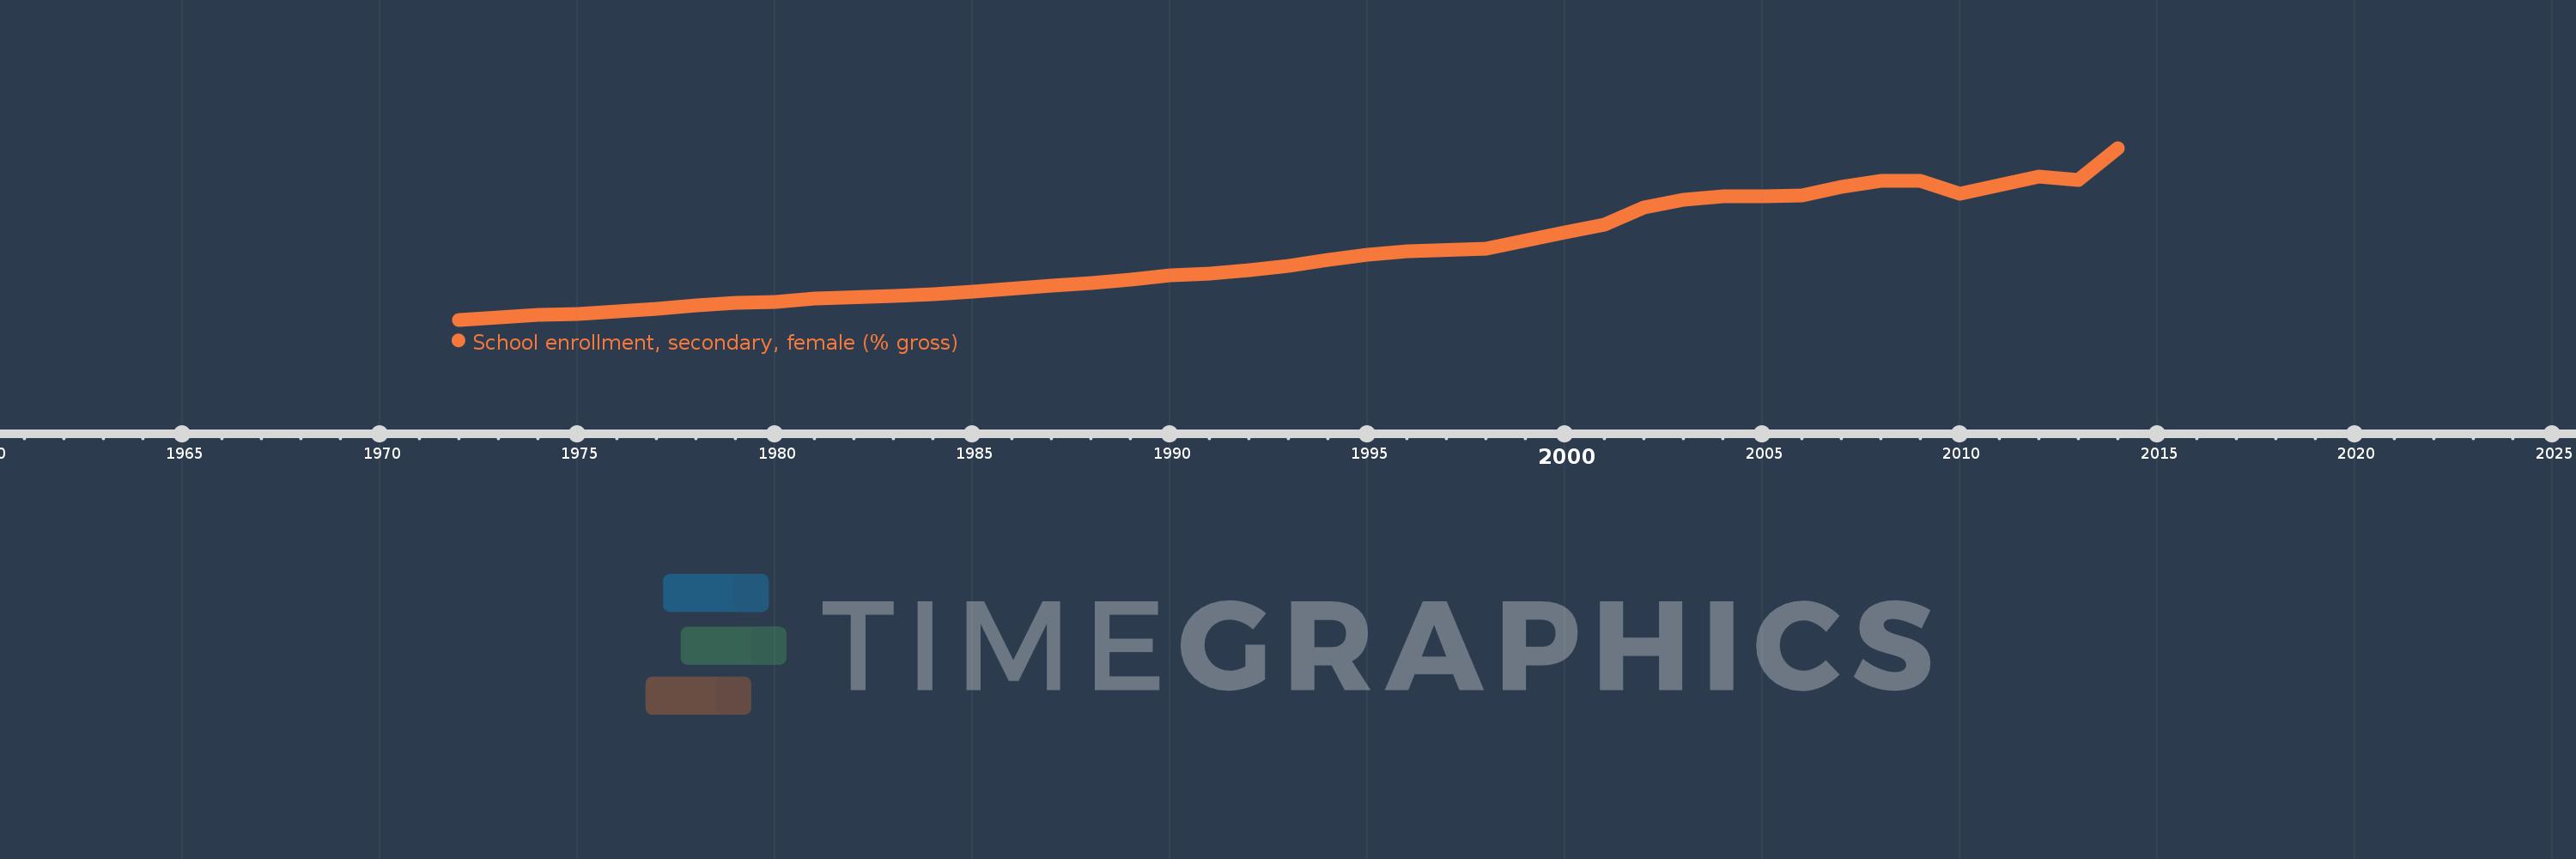
School enrollment, secondary, female (% gross)
2014,2013,2012,2011,2010,2009,2008,2007,2006,2005,2004,2003,2002,2001,2000,1998,1996,1995,1994,1993,1992,1991,1990,1989,1988,1987,1985,1984,1983,1981,1980,1979,1978,1977,1975,1974,1973,1972
This statistics in other country:
AfghanistanAlbaniaAlgeriaAndorraAngolaAntigua and BarbudaArab WorldArgentinaArmeniaArubaAustraliaAustriaAzerbaijanBahamas, TheBahrainBangladeshBarbadosBelarusBelgiumBelizeBeninBermudaBhutanBoliviaBosnia and HerzegovinaBotswanaBrazilBrunei DarussalamBulgariaBurkina FasoBurundiCabo VerdeCambodiaCameroonCanadaCaribbean small statesCentral African RepublicCentral Europe and the BalticsChadChileChinaColombiaComorosCongo, Dem. Rep.Congo, Rep.Costa RicaCote d'IvoireCroatiaCubaCuracaoCyprusCzech RepublicDenmarkDjiboutiDominicaDominican RepublicEarly-demographic dividendEast Asia & PacificEast Asia & Pacific (excluding high income)East Asia & Pacific (IDA & IBRD countries)EcuadorEgypt, Arab Rep.El SalvadorEquatorial GuineaEritreaEstoniaEthiopiaEuro areaEurope & Central AsiaEurope & Central Asia (excluding high income)Europe & Central Asia (IDA & IBRD countries)European UnionFijiFinlandFragile and conflict affected situationsFranceGabonGambia, TheGeorgiaGermanyGhanaGreeceGrenadaGuatemalaGuineaGuinea-BissauGuyanaHeavily indebted poor countries (HIPC)High incomeHondurasHong Kong SAR, ChinaHungaryIBRD onlyIcelandIDA & IBRD totalIDA blendIDA onlyIDA totalIndiaIndonesiaIran, Islamic Rep.IraqIrelandIsraelItalyJamaicaJapanJordanKazakhstanKenyaKiribatiKorea, Dem. People’s Rep.Korea, Rep.KuwaitKyrgyz RepublicLao PDRLate-demographic dividendLatin America & Caribbean Latin America & Caribbean (excluding high income)Latin America & the Caribbean (IDA & IBRD countries)LatviaLeast developed countries: UN classificationLebanonLesothoLiberiaLibyaLiechtensteinLithuaniaLow & middle incomeLow incomeLower middle incomeLuxembourgMacao SAR, ChinaMacedonia, FYRMadagascarMalawiMaldivesMaliMaltaMarshall IslandsMauritaniaMauritiusMexicoMicronesia, Fed. Sts.Middle East & North AfricaMiddle East & North Africa (excluding high income)Middle East & North Africa (IDA & IBRD countries)Middle incomeMoldovaMongoliaMontenegroMoroccoMozambiqueMyanmarNamibiaNauruNepalNetherlandsNew ZealandNicaraguaNigerNigeriaNorth AmericaNorwayOECD membersOmanOther small statesPacific island small statesPakistanPalauPanamaPapua New GuineaParaguayPeruPhilippinesPolandPortugalPost-demographic dividendPre-demographic dividendPuerto RicoQatarRomaniaRussian FederationRwandaSamoaSan MarinoSao Tome and PrincipeSaudi ArabiaSenegalSerbiaSeychellesSierra LeoneSlovak RepublicSloveniaSmall statesSolomon IslandsSomaliaSouth AfricaSouth AsiaSouth Asia (IDA & IBRD)SpainSri LankaSt. Kitts and NevisSt. LuciaSt. Vincent and the GrenadinesSub-Saharan Africa Sub-Saharan Africa (excluding high income)Sub-Saharan Africa (IDA & IBRD countries)SudanSurinameSwazilandSwedenSwitzerlandSyrian Arab RepublicTajikistanTanzaniaThailandTimor-LesteTogoTongaTrinidad and TobagoTunisiaTurkeyTurkmenistanTuvaluUgandaUkraineUnited Arab EmiratesUnited KingdomUnited StatesUpper middle incomeUruguayUzbekistanVanuatuVenezuela, RBVietnamWest Bank and GazaWorldYemen, Rep.ZambiaZimbabwe Timeline:
This timeline shows a graph from 1972 to 2014 of Turkey. No data until 1971. Number of actual observations by date: 38.
Source name:
World Development Indicators
Source organization:
United Nations Educational, Scientific, and Cultural Organization (UNESCO) Institute for Statistics.
Categories, topics:
Education, Gender
Last updated:
apr 23, 2017
Indicators value changes by year
At the date of observation
Value
Absolute change
Change from previous value
jan 1, 1972
14.65
+14.65
0.0%
jan 1, 1973
15.969
+1.318
9.0%
jan 1, 1974
16.856
+0.887
5.55%
jan 1, 1975
17.417
+0.561
3.33%
jan 1, 1977
20.09
+2.673
15.35%
jan 1, 1978
21.484
+1.394
6.94%
jan 1, 1979
22.772
+1.288
5.99%
jan 1, 1980
23.5
+0.728
3.2%
jan 1, 1981
25.017
+1.517
6.46%
jan 1, 1983
26.453
+1.436
5.74%
jan 1, 1984
27.203
+0.749
2.83%
jan 1, 1985
28.417
+1.215
4.47%
jan 1, 1987
31.238
+2.821
9.93%
jan 1, 1988
32.457
+1.219
3.9%
jan 1, 1989
34.189
+1.732
5.34%
jan 1, 1990
36.307
+2.118
6.2%
jan 1, 1991
37.269
+0.962
2.65%
jan 1, 1992
39.074
+1.805
4.84%
jan 1, 1993
40.926
+1.852
4.74%
jan 1, 1994
44.109
+3.183
7.78%
jan 1, 1995
46.354
+2.244
5.09%
jan 1, 1996
48.175
+1.821
3.93%
jan 1, 1998
49.19
+1.015
2.11%
jan 1, 2000
57.234
+8.044
16.35%
jan 1, 2001
60.961
+3.727
6.51%
jan 1, 2002
69.51
+8.549
14.02%
jan 1, 2003
73.226
+3.715
5.35%
jan 1, 2004
75.014
+1.788
2.44%
jan 1, 2005
74.938
-0.076
-0.1%
jan 1, 2006
75.64
+0.702
0.94%
jan 1, 2007
79.749
+4.11
5.43%
jan 1, 2008
82.63
+2.881
3.61%
jan 1, 2009
82.711
+0.081
0.1%
jan 1, 2010
76.143
-6.568
-7.94%
jan 1, 2011
80.456
+4.313
5.66%
jan 1, 2012
84.473
+4.017
4.99%
jan 1, 2013
82.813
-1.66
-1.96%
jan 1, 2014
98.66
+15.847
19.14%
Ranking of countries by current statistics by years


Comments: