29
/
en
AIzaSyAYiBZKx7MnpbEhh9jyipgxe19OcubqV5w
April 1, 2024
55146
Post-demographic dividend
PST
false
2
1
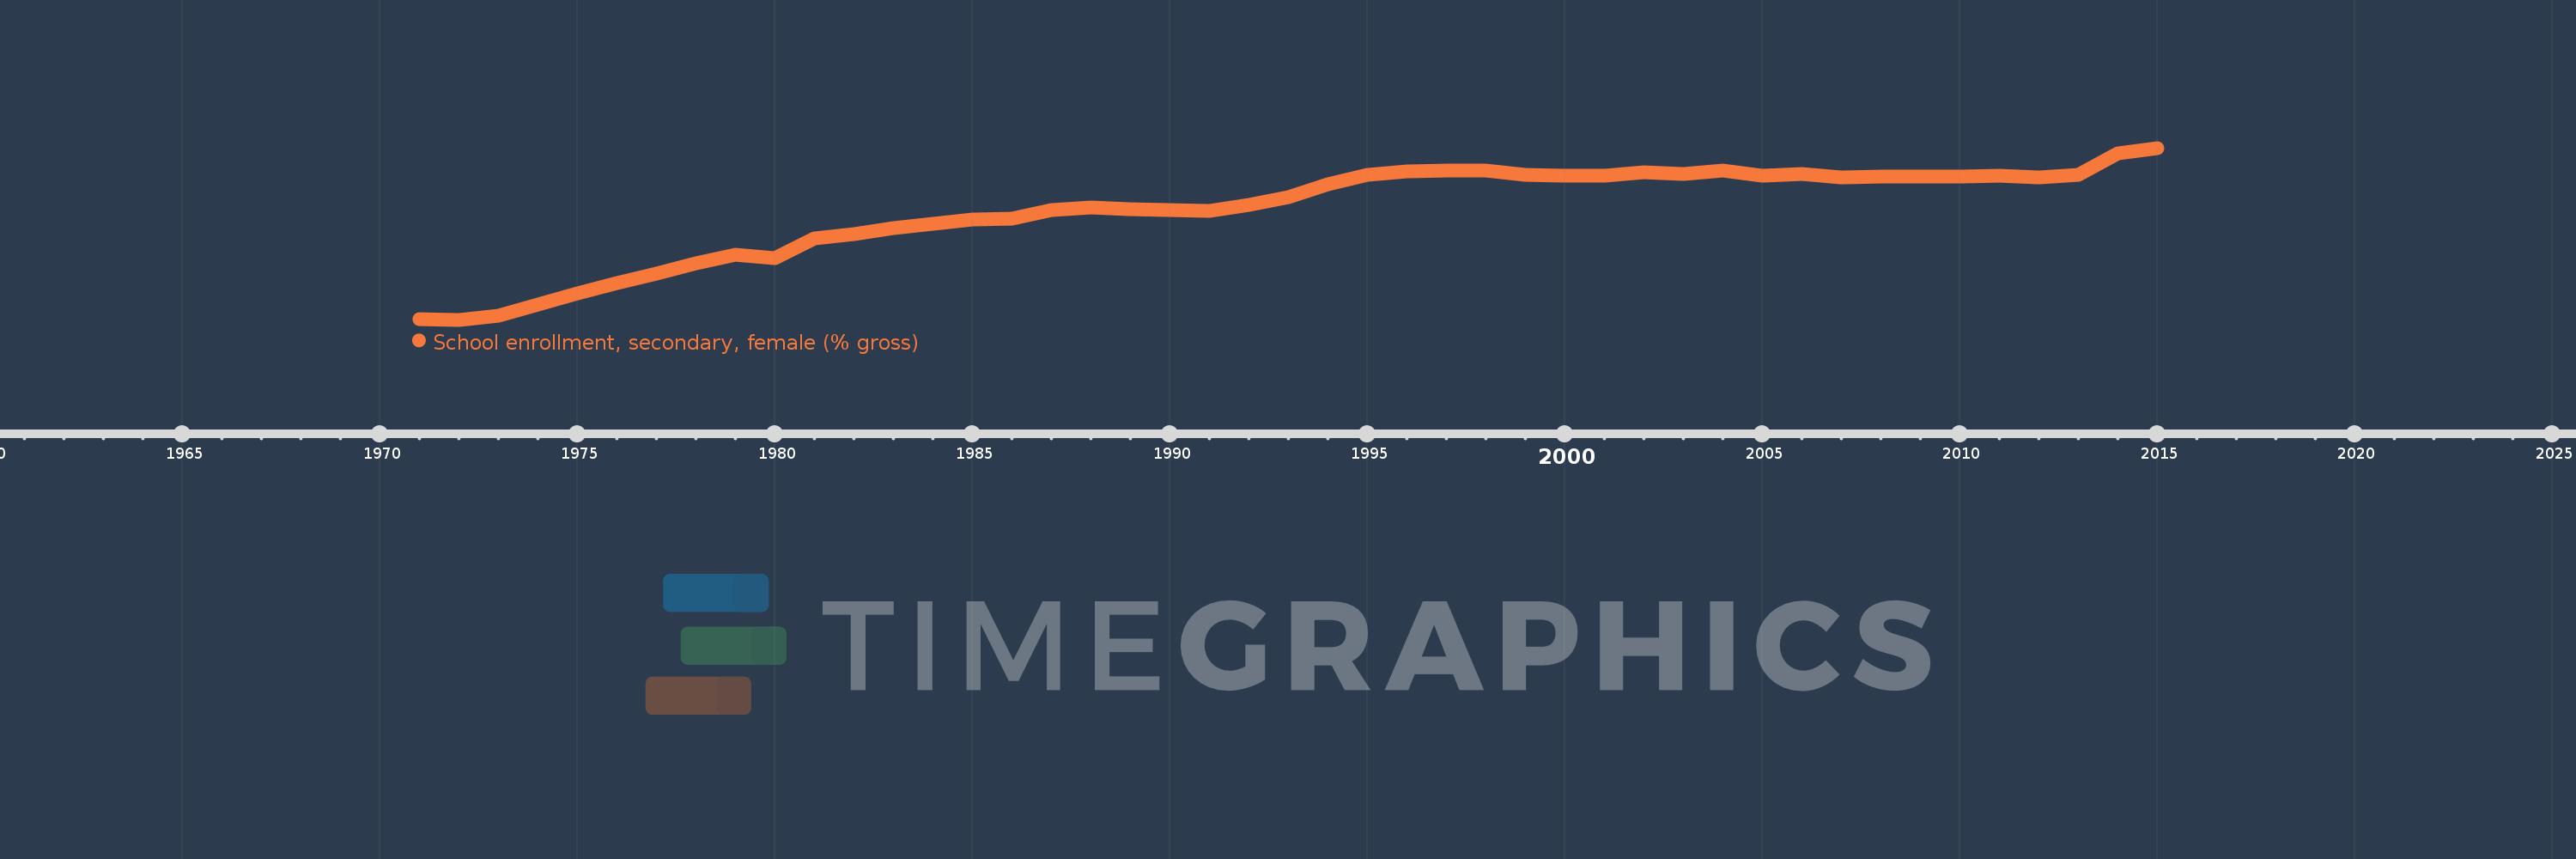
School enrollment, secondary, female (% gross)
2015,2014,2013,2012,2011,2010,2009,2008,2007,2006,2005,2004,2003,2002,2001,2000,1999,1998,1997,1996,1995,1994,1993,1992,1991,1990,1989,1988,1987,1986,1985,1984,1983,1982,1981,1980,1979,1978,1977,1976,1975,1974,1973,1972,1971
This statistics in other country:
AfghanistanAlbaniaAlgeriaAndorraAngolaAntigua and BarbudaArab WorldArgentinaArmeniaArubaAustraliaAustriaAzerbaijanBahamas, TheBahrainBangladeshBarbadosBelarusBelgiumBelizeBeninBermudaBhutanBoliviaBosnia and HerzegovinaBotswanaBrazilBrunei DarussalamBulgariaBurkina FasoBurundiCabo VerdeCambodiaCameroonCanadaCaribbean small statesCentral African RepublicCentral Europe and the BalticsChadChileChinaColombiaComorosCongo, Dem. Rep.Congo, Rep.Costa RicaCote d'IvoireCroatiaCubaCuracaoCyprusCzech RepublicDenmarkDjiboutiDominicaDominican RepublicEarly-demographic dividendEast Asia & PacificEast Asia & Pacific (excluding high income)East Asia & Pacific (IDA & IBRD countries)EcuadorEgypt, Arab Rep.El SalvadorEquatorial GuineaEritreaEstoniaEthiopiaEuro areaEurope & Central AsiaEurope & Central Asia (excluding high income)Europe & Central Asia (IDA & IBRD countries)European UnionFijiFinlandFragile and conflict affected situationsFranceGabonGambia, TheGeorgiaGermanyGhanaGreeceGrenadaGuatemalaGuineaGuinea-BissauGuyanaHeavily indebted poor countries (HIPC)High incomeHondurasHong Kong SAR, ChinaHungaryIBRD onlyIcelandIDA & IBRD totalIDA blendIDA onlyIDA totalIndiaIndonesiaIran, Islamic Rep.IraqIrelandIsraelItalyJamaicaJapanJordanKazakhstanKenyaKiribatiKorea, Dem. People’s Rep.Korea, Rep.KuwaitKyrgyz RepublicLao PDRLate-demographic dividendLatin America & Caribbean Latin America & Caribbean (excluding high income)Latin America & the Caribbean (IDA & IBRD countries)LatviaLeast developed countries: UN classificationLebanonLesothoLiberiaLibyaLiechtensteinLithuaniaLow & middle incomeLow incomeLower middle incomeLuxembourgMacao SAR, ChinaMacedonia, FYRMadagascarMalawiMaldivesMaliMaltaMarshall IslandsMauritaniaMauritiusMexicoMicronesia, Fed. Sts.Middle East & North AfricaMiddle East & North Africa (excluding high income)Middle East & North Africa (IDA & IBRD countries)Middle incomeMoldovaMongoliaMontenegroMoroccoMozambiqueMyanmarNamibiaNauruNepalNetherlandsNew ZealandNicaraguaNigerNigeriaNorth AmericaNorwayOECD membersOmanOther small statesPacific island small statesPakistanPalauPanamaPapua New GuineaParaguayPeruPhilippinesPolandPortugalPost-demographic dividendPre-demographic dividendPuerto RicoQatarRomaniaRussian FederationRwandaSamoaSan MarinoSao Tome and PrincipeSaudi ArabiaSenegalSerbiaSeychellesSierra LeoneSlovak RepublicSloveniaSmall statesSolomon IslandsSomaliaSouth AfricaSouth AsiaSouth Asia (IDA & IBRD)SpainSri LankaSt. Kitts and NevisSt. LuciaSt. Vincent and the GrenadinesSub-Saharan Africa Sub-Saharan Africa (excluding high income)Sub-Saharan Africa (IDA & IBRD countries)SudanSurinameSwazilandSwedenSwitzerlandSyrian Arab RepublicTajikistanTanzaniaThailandTimor-LesteTogoTongaTrinidad and TobagoTunisiaTurkeyTurkmenistanTuvaluUgandaUkraineUnited Arab EmiratesUnited KingdomUnited StatesUpper middle incomeUruguayUzbekistanVanuatuVenezuela, RBVietnamWest Bank and GazaWorldYemen, Rep.ZambiaZimbabwe Timeline:
This timeline shows a graph from 1971 to 2015 of Post-demographic dividend. No data until 1970. Number of actual observations by date: 45.
Source name:
World Development Indicators
Source organization:
United Nations Educational, Scientific, and Cultural Organization (UNESCO) Institute for Statistics.
Categories, topics:
Education, Gender
Last updated:
apr 23, 2017
Indicators value changes by year
Maximum:
106.582
jan 1, 2015
At the date of observation
Value
Absolute change
Change from previous value
jan 1, 1971
72.317
+72.317
0.0%
jan 1, 1972
72.26
-0.057
-0.08%
jan 1, 1973
73.056
+0.796
1.1%
jan 1, 1974
75.34
+2.284
3.13%
jan 1, 1975
77.516
+2.176
2.89%
jan 1, 1976
79.535
+2.019
2.6%
jan 1, 1977
81.517
+1.982
2.49%
jan 1, 1978
83.608
+2.091
2.57%
jan 1, 1979
85.306
+1.698
2.03%
jan 1, 1980
84.496
-0.81
-0.95%
jan 1, 1981
88.468
+3.972
4.7%
jan 1, 1982
89.32
+0.851
0.96%
jan 1, 1983
90.576
+1.256
1.41%
jan 1, 1984
91.372
+0.797
0.88%
jan 1, 1985
92.251
+0.878
0.96%
jan 1, 1986
92.534
+0.283
0.31%
jan 1, 1987
94.136
+1.602
1.73%
jan 1, 1988
94.754
+0.618
0.66%
jan 1, 1989
94.385
-0.369
-0.39%
jan 1, 1990
94.258
-0.127
-0.13%
jan 1, 1991
94.082
-0.176
-0.19%
jan 1, 1992
95.231
+1.149
1.22%
jan 1, 1993
96.68
+1.449
1.52%
jan 1, 1994
99.238
+2.558
2.65%
jan 1, 1995
101.194
+1.956
1.97%
jan 1, 1996
101.841
+0.646
0.64%
jan 1, 1997
102.113
+0.273
0.27%
jan 1, 1998
102.11
-0.003
0.0%
jan 1, 1999
101.181
-0.929
-0.91%
jan 1, 2000
101.046
-0.134
-0.13%
jan 1, 2001
101.114
+0.067
0.07%
jan 1, 2002
101.73
+0.616
0.61%
jan 1, 2003
101.419
-0.31
-0.31%
jan 1, 2004
102.09
+0.671
0.66%
jan 1, 2005
101.112
-0.978
-0.96%
jan 1, 2006
101.39
+0.279
0.28%
jan 1, 2007
100.637
-0.753
-0.74%
jan 1, 2008
100.921
+0.284
0.28%
jan 1, 2009
100.879
-0.042
-0.04%
jan 1, 2010
100.924
+0.045
0.04%
jan 1, 2011
100.978
+0.054
0.05%
jan 1, 2012
100.618
-0.36
-0.36%
jan 1, 2013
101.292
+0.673
0.67%
jan 1, 2014
105.559
+4.268
4.21%
jan 1, 2015
106.582
+1.023
0.97%
Ranking of countries by current statistics by years


Comments: