29
/
en
AIzaSyAYiBZKx7MnpbEhh9jyipgxe19OcubqV5w
April 1, 2024
116226
Cuba
CUB
true
2
1
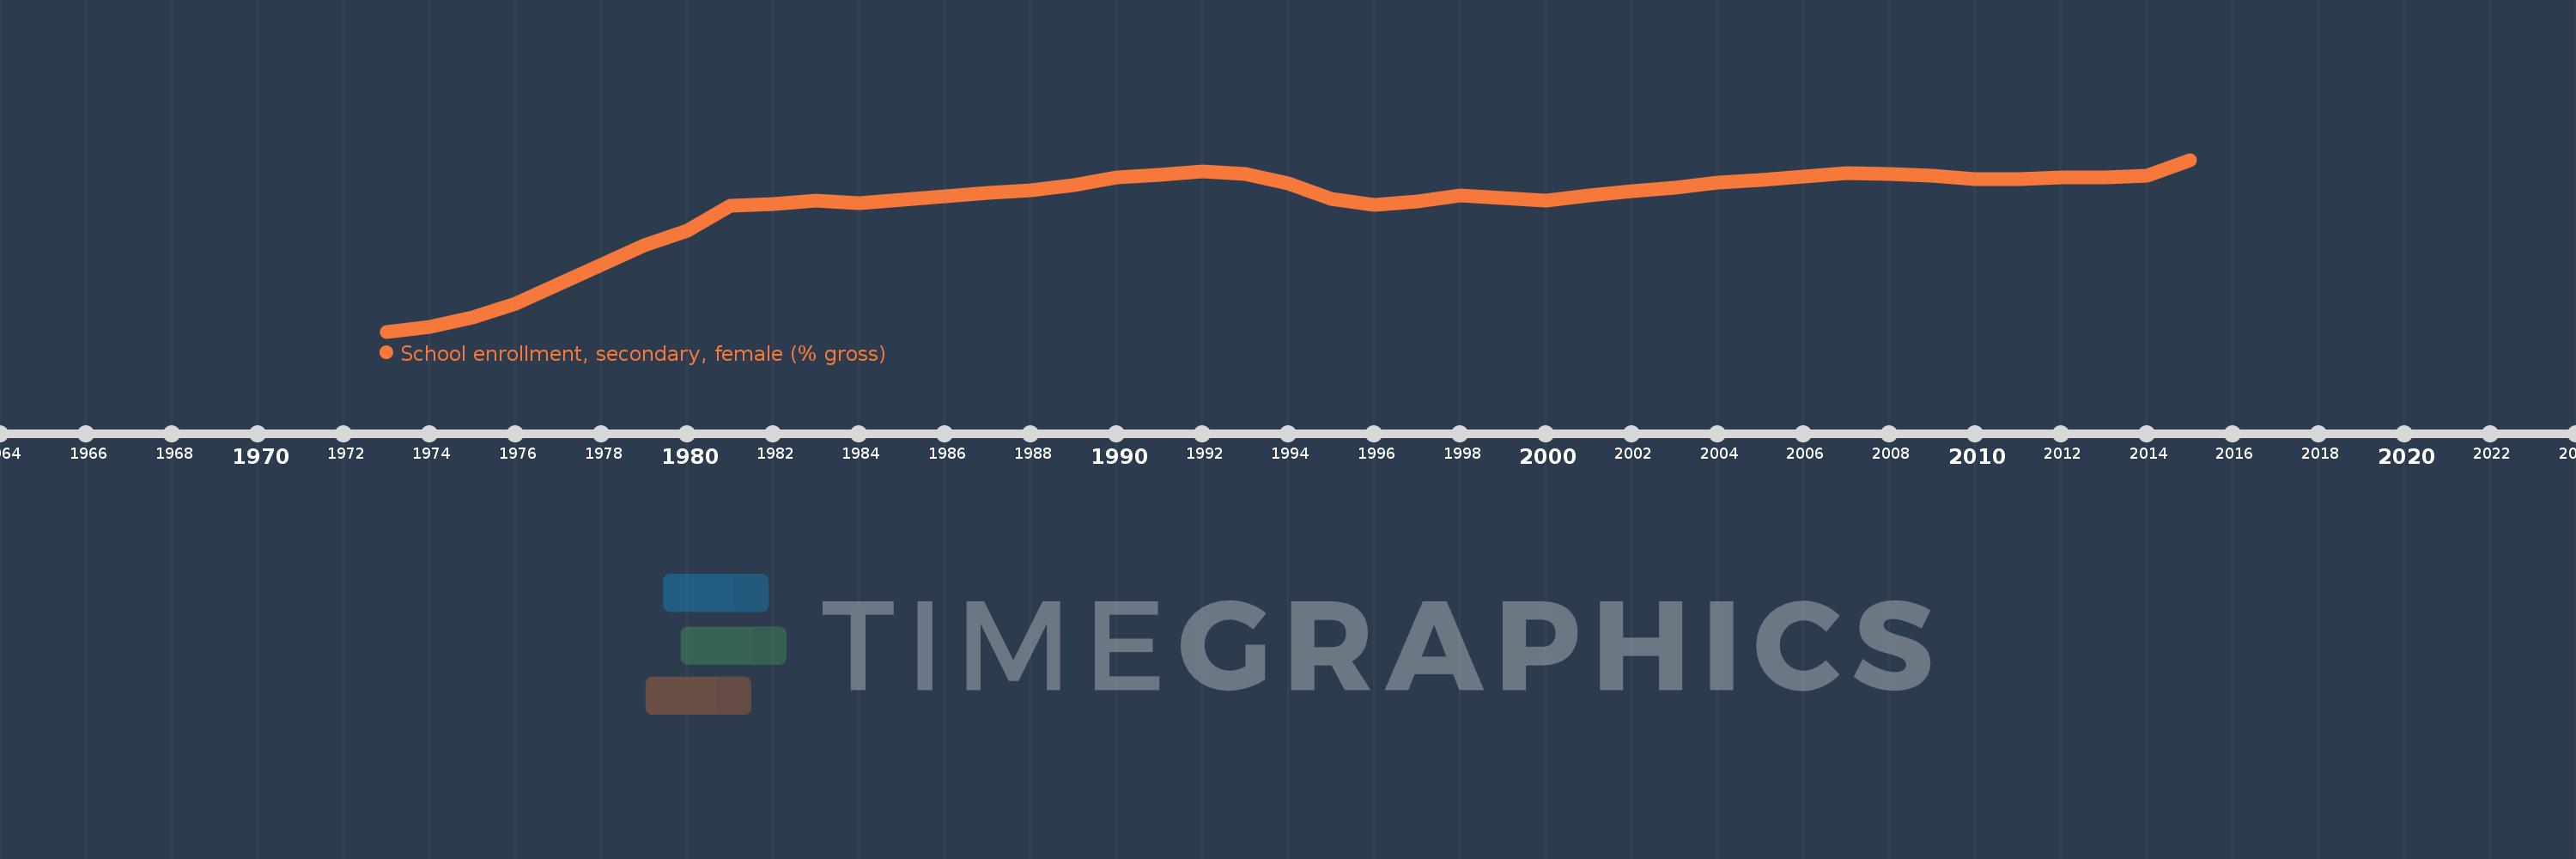
School enrollment, secondary, female (% gross)
2015,2014,2013,2012,2011,2010,2009,2008,2007,2006,2005,2004,2003,2002,2001,2000,1998,1997,1996,1995,1994,1993,1992,1991,1990,1989,1988,1987,1986,1985,1984,1983,1982,1981,1980,1979,1976,1975,1974,1973
This statistics in other country:
AfghanistanAlbaniaAlgeriaAndorraAngolaAntigua and BarbudaArab WorldArgentinaArmeniaArubaAustraliaAustriaAzerbaijanBahamas, TheBahrainBangladeshBarbadosBelarusBelgiumBelizeBeninBermudaBhutanBoliviaBosnia and HerzegovinaBotswanaBrazilBrunei DarussalamBulgariaBurkina FasoBurundiCabo VerdeCambodiaCameroonCanadaCaribbean small statesCentral African RepublicCentral Europe and the BalticsChadChileChinaColombiaComorosCongo, Dem. Rep.Congo, Rep.Costa RicaCote d'IvoireCroatiaCubaCuracaoCyprusCzech RepublicDenmarkDjiboutiDominicaDominican RepublicEarly-demographic dividendEast Asia & PacificEast Asia & Pacific (excluding high income)East Asia & Pacific (IDA & IBRD countries)EcuadorEgypt, Arab Rep.El SalvadorEquatorial GuineaEritreaEstoniaEthiopiaEuro areaEurope & Central AsiaEurope & Central Asia (excluding high income)Europe & Central Asia (IDA & IBRD countries)European UnionFijiFinlandFragile and conflict affected situationsFranceGabonGambia, TheGeorgiaGermanyGhanaGreeceGrenadaGuatemalaGuineaGuinea-BissauGuyanaHeavily indebted poor countries (HIPC)High incomeHondurasHong Kong SAR, ChinaHungaryIBRD onlyIcelandIDA & IBRD totalIDA blendIDA onlyIDA totalIndiaIndonesiaIran, Islamic Rep.IraqIrelandIsraelItalyJamaicaJapanJordanKazakhstanKenyaKiribatiKorea, Dem. People’s Rep.Korea, Rep.KuwaitKyrgyz RepublicLao PDRLate-demographic dividendLatin America & Caribbean Latin America & Caribbean (excluding high income)Latin America & the Caribbean (IDA & IBRD countries)LatviaLeast developed countries: UN classificationLebanonLesothoLiberiaLibyaLiechtensteinLithuaniaLow & middle incomeLow incomeLower middle incomeLuxembourgMacao SAR, ChinaMacedonia, FYRMadagascarMalawiMaldivesMaliMaltaMarshall IslandsMauritaniaMauritiusMexicoMicronesia, Fed. Sts.Middle East & North AfricaMiddle East & North Africa (excluding high income)Middle East & North Africa (IDA & IBRD countries)Middle incomeMoldovaMongoliaMontenegroMoroccoMozambiqueMyanmarNamibiaNauruNepalNetherlandsNew ZealandNicaraguaNigerNigeriaNorth AmericaNorwayOECD membersOmanOther small statesPacific island small statesPakistanPalauPanamaPapua New GuineaParaguayPeruPhilippinesPolandPortugalPost-demographic dividendPre-demographic dividendPuerto RicoQatarRomaniaRussian FederationRwandaSamoaSan MarinoSao Tome and PrincipeSaudi ArabiaSenegalSerbiaSeychellesSierra LeoneSlovak RepublicSloveniaSmall statesSolomon IslandsSomaliaSouth AfricaSouth AsiaSouth Asia (IDA & IBRD)SpainSri LankaSt. Kitts and NevisSt. LuciaSt. Vincent and the GrenadinesSub-Saharan Africa Sub-Saharan Africa (excluding high income)Sub-Saharan Africa (IDA & IBRD countries)SudanSurinameSwazilandSwedenSwitzerlandSyrian Arab RepublicTajikistanTanzaniaThailandTimor-LesteTogoTongaTrinidad and TobagoTunisiaTurkeyTurkmenistanTuvaluUgandaUkraineUnited Arab EmiratesUnited KingdomUnited StatesUpper middle incomeUruguayUzbekistanVanuatuVenezuela, RBVietnamWest Bank and GazaWorldYemen, Rep.ZambiaZimbabwe Timeline:
This timeline shows a graph from 1973 to 2015 of Cuba. No data until 1972. Number of actual observations by date: 40.
Source name:
World Development Indicators
Source organization:
United Nations Educational, Scientific, and Cultural Organization (UNESCO) Institute for Statistics.
Categories, topics:
Education, Gender
Last updated:
apr 23, 2017
Indicators value changes by year
Minimum:
21.955
jan 1, 1973
Maximum:
101.41
jan 1, 2015
At the date of observation
Value
Absolute change
Change from previous value
jan 1, 1973
21.955
+21.955
0.0%
jan 1, 1974
24.117
+2.162
9.85%
jan 1, 1975
28.365
+4.248
17.62%
jan 1, 1976
34.904
+6.539
23.05%
jan 1, 1979
62.007
+27.103
77.65%
jan 1, 1980
68.573
+6.566
10.59%
jan 1, 1981
79.998
+11.425
16.66%
jan 1, 1982
80.999
+1.001
1.25%
jan 1, 1983
82.441
+1.442
1.78%
jan 1, 1984
81.447
-0.995
-1.21%
jan 1, 1985
82.968
+1.521
1.87%
jan 1, 1986
84.356
+1.388
1.67%
jan 1, 1987
86.13
+1.775
2.1%
jan 1, 1988
87.368
+1.237
1.44%
jan 1, 1989
89.695
+2.327
2.66%
jan 1, 1990
93.129
+3.434
3.83%
jan 1, 1991
94.501
+1.372
1.47%
jan 1, 1992
95.881
+1.38
1.46%
jan 1, 1993
95.039
-0.841
-0.88%
jan 1, 1994
90.448
-4.591
-4.83%
jan 1, 1995
83.512
-6.936
-7.67%
jan 1, 1996
80.528
-2.984
-3.57%
jan 1, 1997
82.153
+1.625
2.02%
jan 1, 1998
84.818
+2.665
3.24%
jan 1, 2000
82.402
-2.416
-2.85%
jan 1, 2001
84.734
+2.332
2.83%
jan 1, 2002
86.966
+2.231
2.63%
jan 1, 2003
88.319
+1.353
1.56%
jan 1, 2004
90.946
+2.627
2.97%
jan 1, 2005
91.893
+0.947
1.04%
jan 1, 2006
93.58
+1.687
1.84%
jan 1, 2007
95.409
+1.829
1.95%
jan 1, 2008
94.799
-0.611
-0.64%
jan 1, 2009
94.085
-0.714
-0.75%
jan 1, 2010
92.372
-1.713
-1.82%
jan 1, 2011
92.527
+0.155
0.17%
jan 1, 2012
93.199
+0.672
0.73%
jan 1, 2013
93.408
+0.209
0.22%
jan 1, 2014
94.24
+0.831
0.89%
jan 1, 2015
101.41
+7.17
7.61%
Ranking of countries by current statistics by years


Comments: