29
/
en
AIzaSyAYiBZKx7MnpbEhh9jyipgxe19OcubqV5w
April 1, 2024
124188
Ecuador
ECU
true
2
1
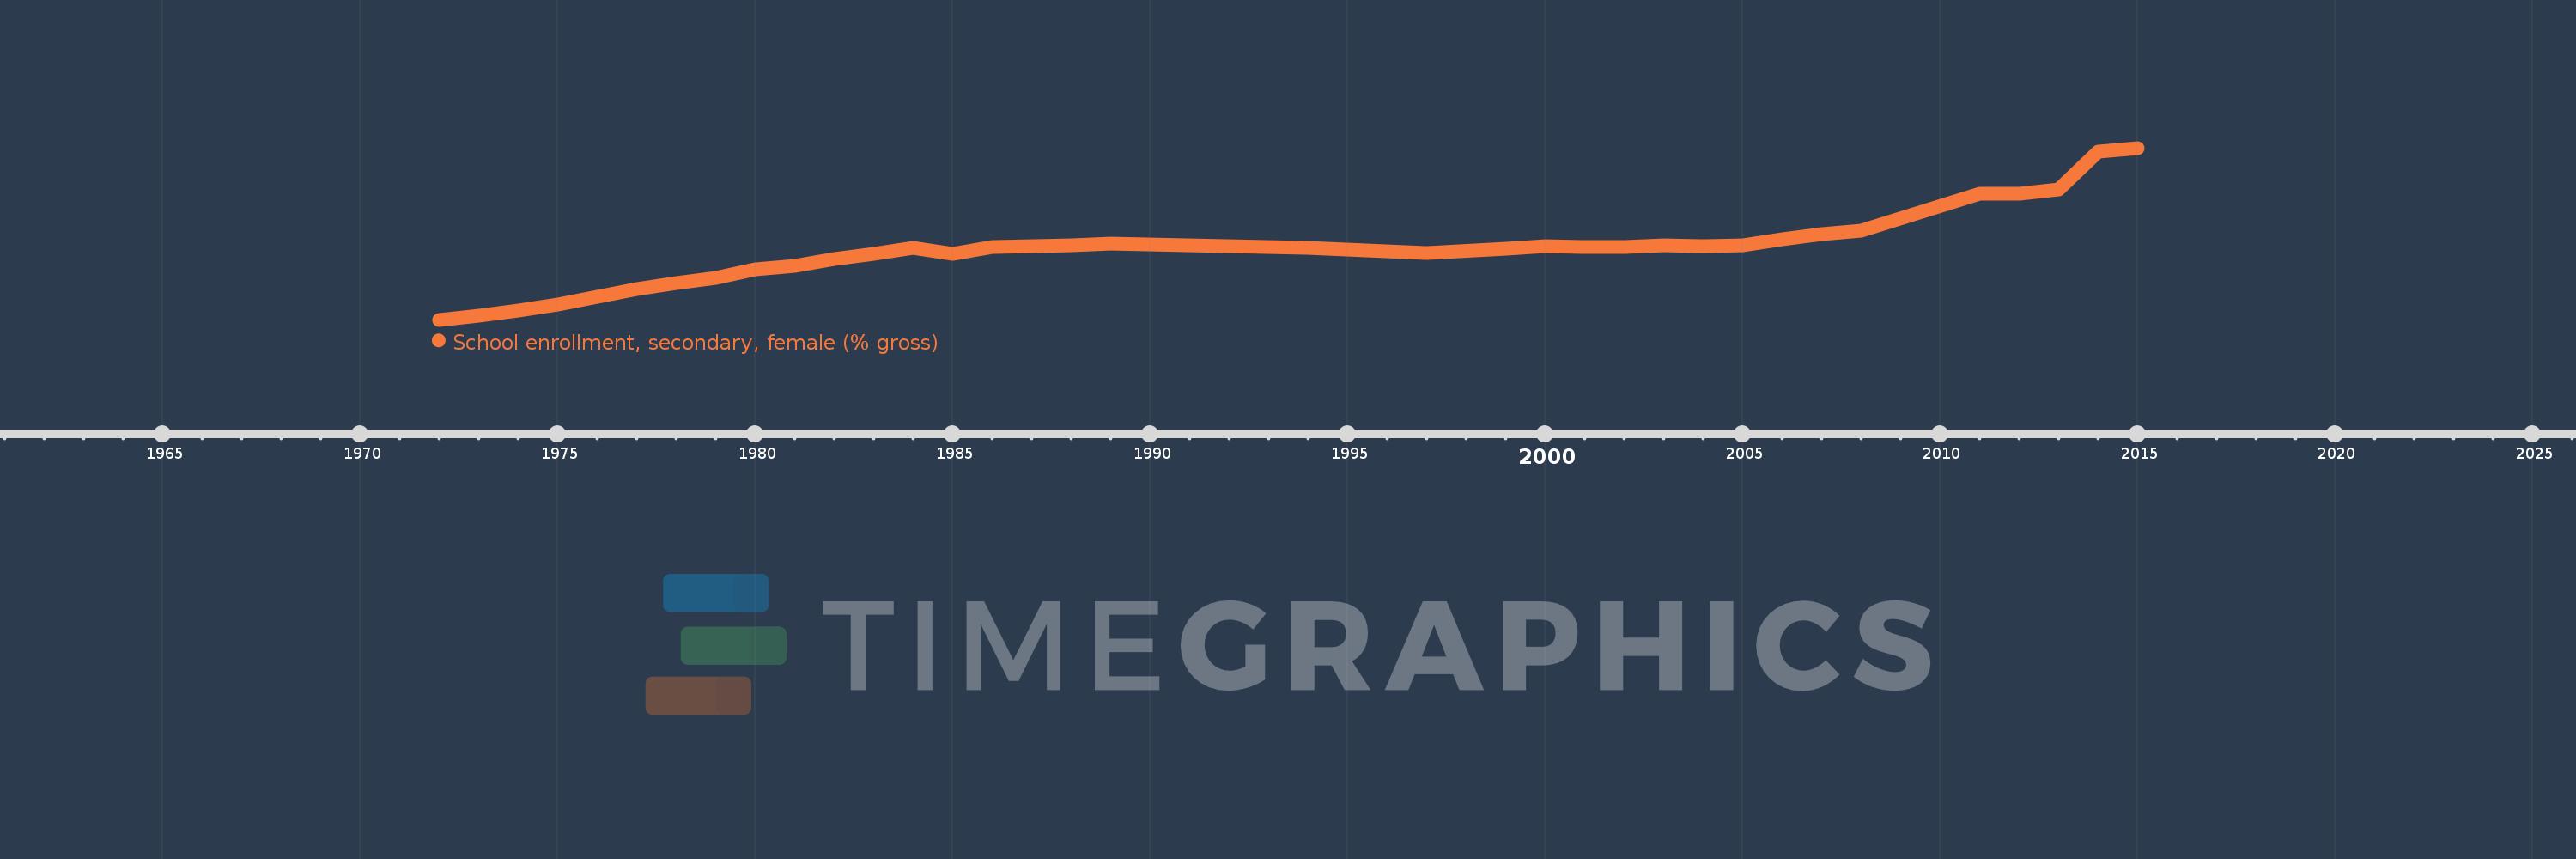
School enrollment, secondary, female (% gross)
2015,2014,2013,2012,2011,2008,2007,2006,2005,2004,2003,2002,2001,2000,1999,1997,1994,1989,1988,1987,1986,1985,1984,1983,1982,1981,1980,1979,1978,1977,1976,1975,1974,1973,1972
This statistics in other country:
AfghanistanAlbaniaAlgeriaAndorraAngolaAntigua and BarbudaArab WorldArgentinaArmeniaArubaAustraliaAustriaAzerbaijanBahamas, TheBahrainBangladeshBarbadosBelarusBelgiumBelizeBeninBermudaBhutanBoliviaBosnia and HerzegovinaBotswanaBrazilBrunei DarussalamBulgariaBurkina FasoBurundiCabo VerdeCambodiaCameroonCanadaCaribbean small statesCentral African RepublicCentral Europe and the BalticsChadChileChinaColombiaComorosCongo, Dem. Rep.Congo, Rep.Costa RicaCote d'IvoireCroatiaCubaCuracaoCyprusCzech RepublicDenmarkDjiboutiDominicaDominican RepublicEarly-demographic dividendEast Asia & PacificEast Asia & Pacific (excluding high income)East Asia & Pacific (IDA & IBRD countries)EcuadorEgypt, Arab Rep.El SalvadorEquatorial GuineaEritreaEstoniaEthiopiaEuro areaEurope & Central AsiaEurope & Central Asia (excluding high income)Europe & Central Asia (IDA & IBRD countries)European UnionFijiFinlandFragile and conflict affected situationsFranceGabonGambia, TheGeorgiaGermanyGhanaGreeceGrenadaGuatemalaGuineaGuinea-BissauGuyanaHeavily indebted poor countries (HIPC)High incomeHondurasHong Kong SAR, ChinaHungaryIBRD onlyIcelandIDA & IBRD totalIDA blendIDA onlyIDA totalIndiaIndonesiaIran, Islamic Rep.IraqIrelandIsraelItalyJamaicaJapanJordanKazakhstanKenyaKiribatiKorea, Dem. People’s Rep.Korea, Rep.KuwaitKyrgyz RepublicLao PDRLate-demographic dividendLatin America & Caribbean Latin America & Caribbean (excluding high income)Latin America & the Caribbean (IDA & IBRD countries)LatviaLeast developed countries: UN classificationLebanonLesothoLiberiaLibyaLiechtensteinLithuaniaLow & middle incomeLow incomeLower middle incomeLuxembourgMacao SAR, ChinaMacedonia, FYRMadagascarMalawiMaldivesMaliMaltaMarshall IslandsMauritaniaMauritiusMexicoMicronesia, Fed. Sts.Middle East & North AfricaMiddle East & North Africa (excluding high income)Middle East & North Africa (IDA & IBRD countries)Middle incomeMoldovaMongoliaMontenegroMoroccoMozambiqueMyanmarNamibiaNauruNepalNetherlandsNew ZealandNicaraguaNigerNigeriaNorth AmericaNorwayOECD membersOmanOther small statesPacific island small statesPakistanPalauPanamaPapua New GuineaParaguayPeruPhilippinesPolandPortugalPost-demographic dividendPre-demographic dividendPuerto RicoQatarRomaniaRussian FederationRwandaSamoaSan MarinoSao Tome and PrincipeSaudi ArabiaSenegalSerbiaSeychellesSierra LeoneSlovak RepublicSloveniaSmall statesSolomon IslandsSomaliaSouth AfricaSouth AsiaSouth Asia (IDA & IBRD)SpainSri LankaSt. Kitts and NevisSt. LuciaSt. Vincent and the GrenadinesSub-Saharan Africa Sub-Saharan Africa (excluding high income)Sub-Saharan Africa (IDA & IBRD countries)SudanSurinameSwazilandSwedenSwitzerlandSyrian Arab RepublicTajikistanTanzaniaThailandTimor-LesteTogoTongaTrinidad and TobagoTunisiaTurkeyTurkmenistanTuvaluUgandaUkraineUnited Arab EmiratesUnited KingdomUnited StatesUpper middle incomeUruguayUzbekistanVanuatuVenezuela, RBVietnamWest Bank and GazaWorldYemen, Rep.ZambiaZimbabwe Timeline:
This timeline shows a graph from 1972 to 2015 of Ecuador. No data until 1971. Number of actual observations by date: 35.
Source name:
World Development Indicators
Source organization:
United Nations Educational, Scientific, and Cultural Organization (UNESCO) Institute for Statistics.
Categories, topics:
Education, Gender
Last updated:
apr 23, 2017
Indicators value changes by year
Minimum:
23.347
jan 1, 1972
Maximum:
106.314
jan 1, 2015
At the date of observation
Value
Absolute change
Change from previous value
jan 1, 1972
23.347
+23.347
0.0%
jan 1, 1973
25.339
+1.992
8.53%
jan 1, 1974
27.92
+2.581
10.19%
jan 1, 1975
30.894
+2.973
10.65%
jan 1, 1976
34.319
+3.425
11.09%
jan 1, 1977
38.044
+3.725
10.85%
jan 1, 1978
41.106
+3.063
8.05%
jan 1, 1979
43.407
+2.3
5.6%
jan 1, 1980
47.74
+4.333
9.98%
jan 1, 1981
49.421
+1.681
3.52%
jan 1, 1982
52.874
+3.453
6.99%
jan 1, 1983
55.237
+2.364
4.47%
jan 1, 1984
58.076
+2.839
5.14%
jan 1, 1985
55.082
-2.994
-5.15%
jan 1, 1986
58.426
+3.343
6.07%
jan 1, 1987
58.837
+0.411
0.7%
jan 1, 1988
59.29
+0.453
0.77%
jan 1, 1989
60.026
+0.737
1.24%
jan 1, 1994
57.983
-2.043
-3.4%
jan 1, 1997
55.53
-2.453
-4.23%
jan 1, 1999
57.689
+2.159
3.89%
jan 1, 2000
58.73
+1.04
1.8%
jan 1, 2001
58.334
-0.395
-0.67%
jan 1, 2002
58.674
+0.34
0.58%
jan 1, 2003
59.227
+0.552
0.94%
jan 1, 2004
59.075
-0.151
-0.26%
jan 1, 2005
59.302
+0.226
0.38%
jan 1, 2006
62.219
+2.917
4.92%
jan 1, 2007
64.706
+2.488
4.0%
jan 1, 2008
66.333
+1.626
2.51%
jan 1, 2011
84.118
+17.785
26.81%
jan 1, 2012
84.084
-0.034
-0.04%
jan 1, 2013
86.152
+2.068
2.46%
jan 1, 2014
104.483
+18.331
21.28%
jan 1, 2015
106.314
+1.831
1.75%
Ranking of countries by current statistics by years


Comments: