29
/
en
AIzaSyAYiBZKx7MnpbEhh9jyipgxe19OcubqV5w
April 1, 2024
266316
Tonga
TON
true
2
1
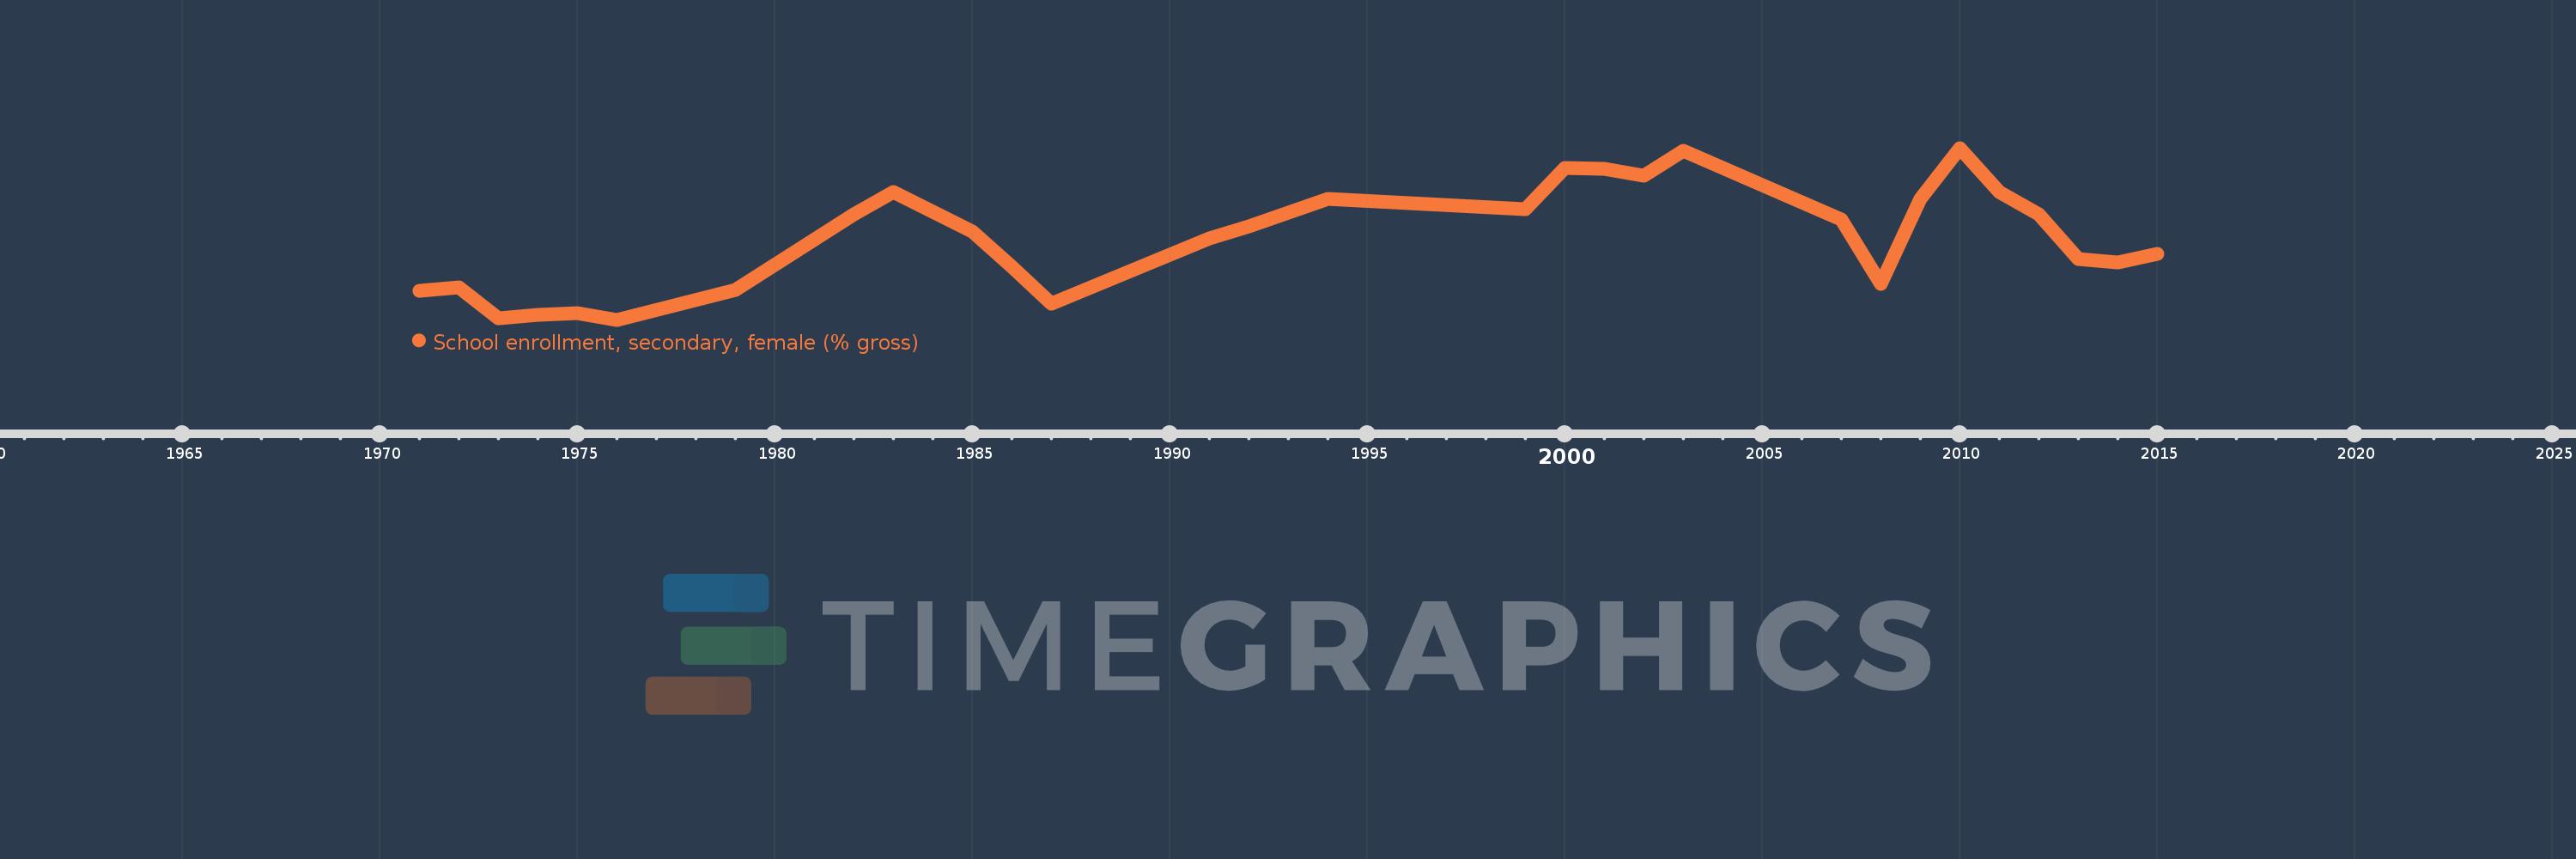
School enrollment, secondary, female (% gross)
2015,2014,2013,2012,2011,2010,2009,2008,2007,2003,2002,2001,2000,1999,1994,1992,1991,1987,1986,1985,1983,1982,1979,1976,1975,1974,1973,1972,1971
This statistics in other country:
AfghanistanAlbaniaAlgeriaAndorraAngolaAntigua and BarbudaArab WorldArgentinaArmeniaArubaAustraliaAustriaAzerbaijanBahamas, TheBahrainBangladeshBarbadosBelarusBelgiumBelizeBeninBermudaBhutanBoliviaBosnia and HerzegovinaBotswanaBrazilBrunei DarussalamBulgariaBurkina FasoBurundiCabo VerdeCambodiaCameroonCanadaCaribbean small statesCentral African RepublicCentral Europe and the BalticsChadChileChinaColombiaComorosCongo, Dem. Rep.Congo, Rep.Costa RicaCote d'IvoireCroatiaCubaCuracaoCyprusCzech RepublicDenmarkDjiboutiDominicaDominican RepublicEarly-demographic dividendEast Asia & PacificEast Asia & Pacific (excluding high income)East Asia & Pacific (IDA & IBRD countries)EcuadorEgypt, Arab Rep.El SalvadorEquatorial GuineaEritreaEstoniaEthiopiaEuro areaEurope & Central AsiaEurope & Central Asia (excluding high income)Europe & Central Asia (IDA & IBRD countries)European UnionFijiFinlandFragile and conflict affected situationsFranceGabonGambia, TheGeorgiaGermanyGhanaGreeceGrenadaGuatemalaGuineaGuinea-BissauGuyanaHeavily indebted poor countries (HIPC)High incomeHondurasHong Kong SAR, ChinaHungaryIBRD onlyIcelandIDA & IBRD totalIDA blendIDA onlyIDA totalIndiaIndonesiaIran, Islamic Rep.IraqIrelandIsraelItalyJamaicaJapanJordanKazakhstanKenyaKiribatiKorea, Dem. People’s Rep.Korea, Rep.KuwaitKyrgyz RepublicLao PDRLate-demographic dividendLatin America & Caribbean Latin America & Caribbean (excluding high income)Latin America & the Caribbean (IDA & IBRD countries)LatviaLeast developed countries: UN classificationLebanonLesothoLiberiaLibyaLiechtensteinLithuaniaLow & middle incomeLow incomeLower middle incomeLuxembourgMacao SAR, ChinaMacedonia, FYRMadagascarMalawiMaldivesMaliMaltaMarshall IslandsMauritaniaMauritiusMexicoMicronesia, Fed. Sts.Middle East & North AfricaMiddle East & North Africa (excluding high income)Middle East & North Africa (IDA & IBRD countries)Middle incomeMoldovaMongoliaMontenegroMoroccoMozambiqueMyanmarNamibiaNauruNepalNetherlandsNew ZealandNicaraguaNigerNigeriaNorth AmericaNorwayOECD membersOmanOther small statesPacific island small statesPakistanPalauPanamaPapua New GuineaParaguayPeruPhilippinesPolandPortugalPost-demographic dividendPre-demographic dividendPuerto RicoQatarRomaniaRussian FederationRwandaSamoaSan MarinoSao Tome and PrincipeSaudi ArabiaSenegalSerbiaSeychellesSierra LeoneSlovak RepublicSloveniaSmall statesSolomon IslandsSomaliaSouth AfricaSouth AsiaSouth Asia (IDA & IBRD)SpainSri LankaSt. Kitts and NevisSt. LuciaSt. Vincent and the GrenadinesSub-Saharan Africa Sub-Saharan Africa (excluding high income)Sub-Saharan Africa (IDA & IBRD countries)SudanSurinameSwazilandSwedenSwitzerlandSyrian Arab RepublicTajikistanTanzaniaThailandTimor-LesteTogoTongaTrinidad and TobagoTunisiaTurkeyTurkmenistanTuvaluUgandaUkraineUnited Arab EmiratesUnited KingdomUnited StatesUpper middle incomeUruguayUzbekistanVanuatuVenezuela, RBVietnamWest Bank and GazaWorldYemen, Rep.ZambiaZimbabwe Timeline:
This timeline shows a graph from 1971 to 2015 of Tonga. No data until 1970. Number of actual observations by date: 29.
Source name:
World Development Indicators
Source organization:
United Nations Educational, Scientific, and Cultural Organization (UNESCO) Institute for Statistics.
Categories, topics:
Education, Gender
Last updated:
apr 23, 2017
Indicators value changes by year
Maximum:
117.258
jan 1, 2010
At the date of observation
Value
Absolute change
Change from previous value
jan 1, 1971
86.131
+86.131
0.0%
jan 1, 1972
86.743
+0.612
0.71%
jan 1, 1973
80.139
-6.604
-7.61%
jan 1, 1974
80.843
+0.704
0.88%
jan 1, 1975
81.182
+0.34
0.42%
jan 1, 1976
79.75
-1.433
-1.76%
jan 1, 1979
86.249
+6.499
8.15%
jan 1, 1982
102.817
+16.567
19.21%
jan 1, 1983
107.717
+4.9
4.77%
jan 1, 1985
98.984
-8.733
-8.11%
jan 1, 1986
91.399
-7.585
-7.66%
jan 1, 1987
83.208
-8.192
-8.96%
jan 1, 1991
97.506
+14.298
17.18%
jan 1, 1992
100.221
+2.715
2.78%
jan 1, 1994
106.119
+5.898
5.89%
jan 1, 1999
103.834
-2.285
-2.15%
jan 1, 2000
112.853
+9.019
8.69%
jan 1, 2001
112.759
-0.093
-0.08%
jan 1, 2002
111.294
-1.465
-1.3%
jan 1, 2003
116.645
+5.351
4.81%
jan 1, 2007
101.643
-15.002
-12.86%
jan 1, 2008
87.571
-14.072
-13.84%
jan 1, 2009
106.052
+18.482
21.1%
jan 1, 2010
117.258
+11.206
10.57%
jan 1, 2011
107.693
-9.565
-8.16%
jan 1, 2012
102.761
-4.933
-4.58%
jan 1, 2013
93.054
-9.707
-9.45%
jan 1, 2014
92.173
-0.881
-0.95%
jan 1, 2015
94.221
+2.048
2.22%
Ranking of countries by current statistics by years


Comments: