29
/
en
AIzaSyAYiBZKx7MnpbEhh9jyipgxe19OcubqV5w
April 1, 2024
110340
Congo, Dem. Rep.
COD
true
2
1
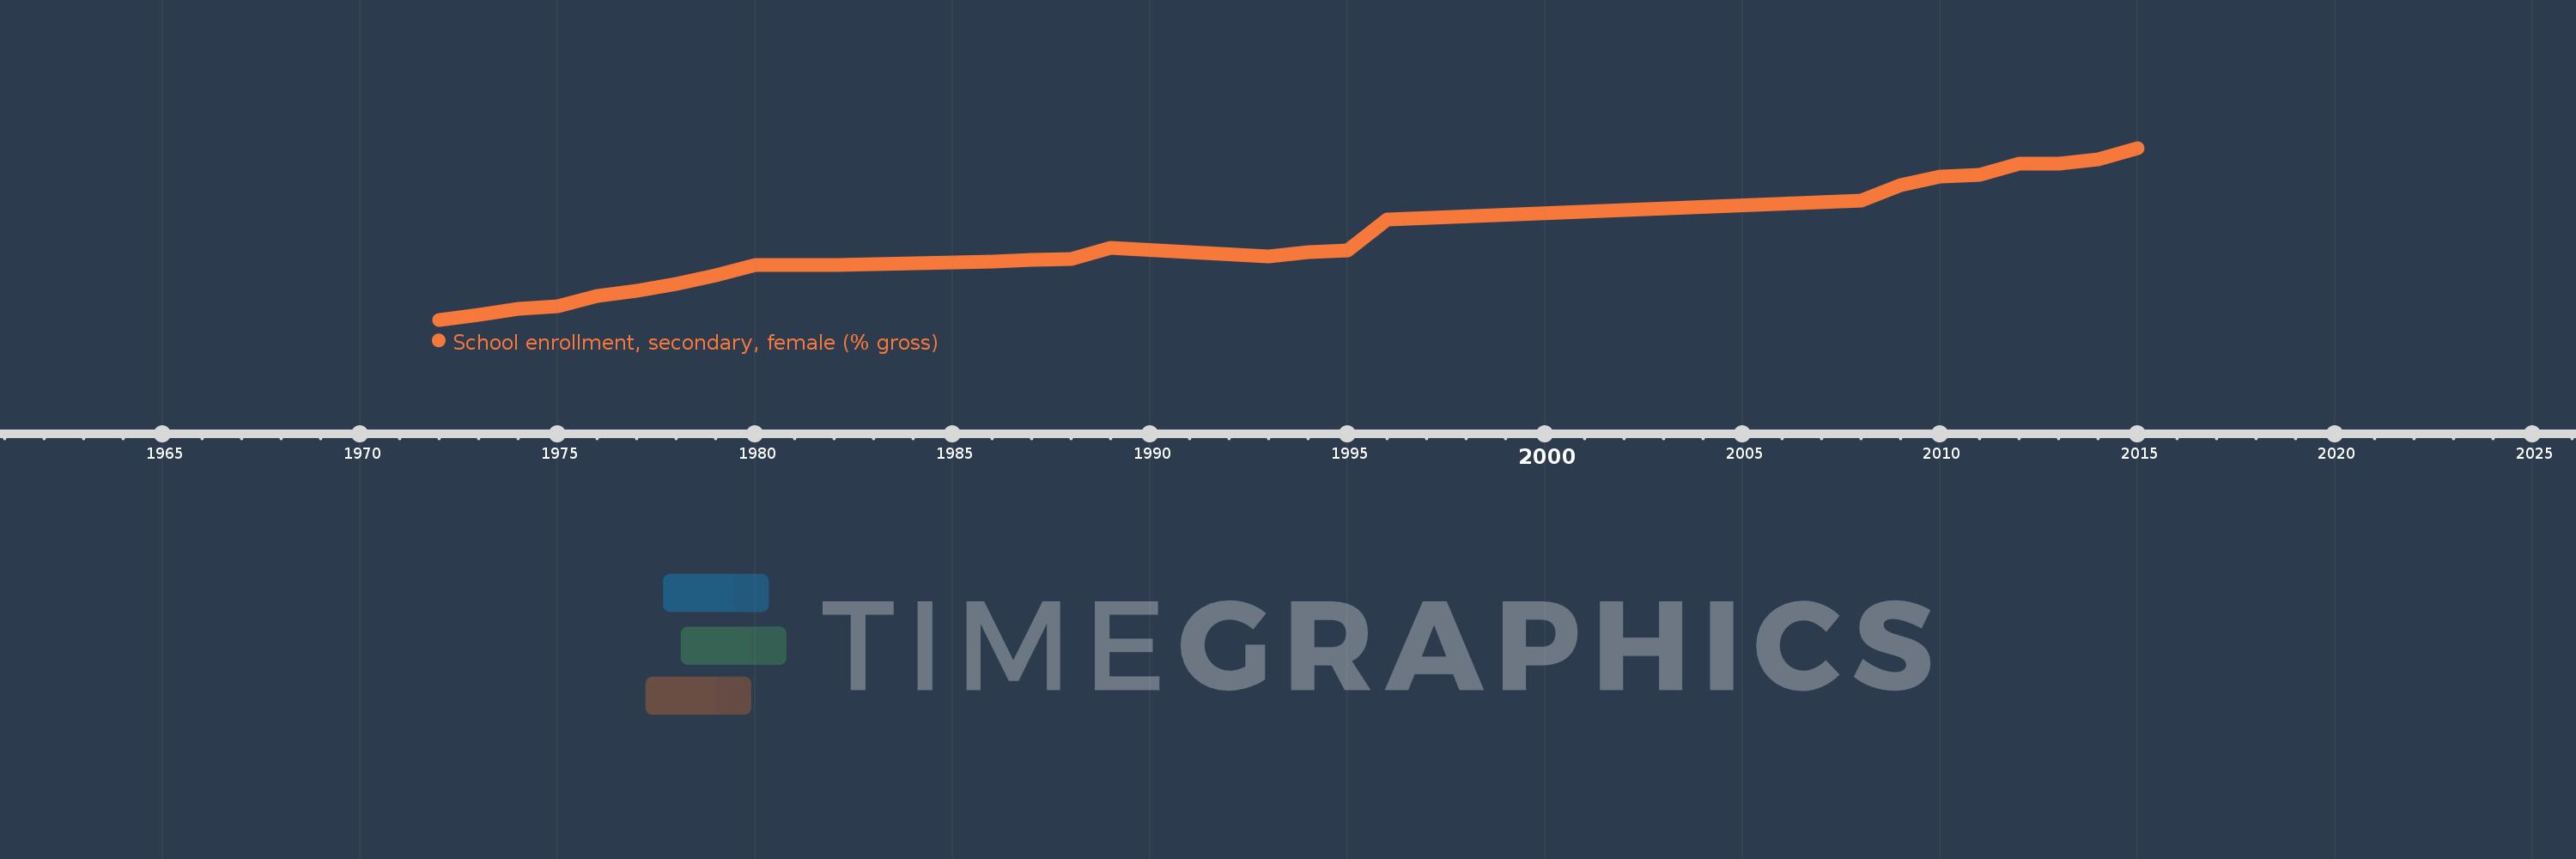
School enrollment, secondary, female (% gross)
2015,2014,2013,2012,2011,2010,2009,2008,1996,1995,1994,1993,1989,1988,1987,1986,1985,1984,1983,1982,1981,1980,1979,1978,1977,1976,1975,1974,1973,1972
This statistics in other country:
AfghanistanAlbaniaAlgeriaAndorraAngolaAntigua and BarbudaArab WorldArgentinaArmeniaArubaAustraliaAustriaAzerbaijanBahamas, TheBahrainBangladeshBarbadosBelarusBelgiumBelizeBeninBermudaBhutanBoliviaBosnia and HerzegovinaBotswanaBrazilBrunei DarussalamBulgariaBurkina FasoBurundiCabo VerdeCambodiaCameroonCanadaCaribbean small statesCentral African RepublicCentral Europe and the BalticsChadChileChinaColombiaComorosCongo, Dem. Rep.Congo, Rep.Costa RicaCote d'IvoireCroatiaCubaCuracaoCyprusCzech RepublicDenmarkDjiboutiDominicaDominican RepublicEarly-demographic dividendEast Asia & PacificEast Asia & Pacific (excluding high income)East Asia & Pacific (IDA & IBRD countries)EcuadorEgypt, Arab Rep.El SalvadorEquatorial GuineaEritreaEstoniaEthiopiaEuro areaEurope & Central AsiaEurope & Central Asia (excluding high income)Europe & Central Asia (IDA & IBRD countries)European UnionFijiFinlandFragile and conflict affected situationsFranceGabonGambia, TheGeorgiaGermanyGhanaGreeceGrenadaGuatemalaGuineaGuinea-BissauGuyanaHeavily indebted poor countries (HIPC)High incomeHondurasHong Kong SAR, ChinaHungaryIBRD onlyIcelandIDA & IBRD totalIDA blendIDA onlyIDA totalIndiaIndonesiaIran, Islamic Rep.IraqIrelandIsraelItalyJamaicaJapanJordanKazakhstanKenyaKiribatiKorea, Dem. People’s Rep.Korea, Rep.KuwaitKyrgyz RepublicLao PDRLate-demographic dividendLatin America & Caribbean Latin America & Caribbean (excluding high income)Latin America & the Caribbean (IDA & IBRD countries)LatviaLeast developed countries: UN classificationLebanonLesothoLiberiaLibyaLiechtensteinLithuaniaLow & middle incomeLow incomeLower middle incomeLuxembourgMacao SAR, ChinaMacedonia, FYRMadagascarMalawiMaldivesMaliMaltaMarshall IslandsMauritaniaMauritiusMexicoMicronesia, Fed. Sts.Middle East & North AfricaMiddle East & North Africa (excluding high income)Middle East & North Africa (IDA & IBRD countries)Middle incomeMoldovaMongoliaMontenegroMoroccoMozambiqueMyanmarNamibiaNauruNepalNetherlandsNew ZealandNicaraguaNigerNigeriaNorth AmericaNorwayOECD membersOmanOther small statesPacific island small statesPakistanPalauPanamaPapua New GuineaParaguayPeruPhilippinesPolandPortugalPost-demographic dividendPre-demographic dividendPuerto RicoQatarRomaniaRussian FederationRwandaSamoaSan MarinoSao Tome and PrincipeSaudi ArabiaSenegalSerbiaSeychellesSierra LeoneSlovak RepublicSloveniaSmall statesSolomon IslandsSomaliaSouth AfricaSouth AsiaSouth Asia (IDA & IBRD)SpainSri LankaSt. Kitts and NevisSt. LuciaSt. Vincent and the GrenadinesSub-Saharan Africa Sub-Saharan Africa (excluding high income)Sub-Saharan Africa (IDA & IBRD countries)SudanSurinameSwazilandSwedenSwitzerlandSyrian Arab RepublicTajikistanTanzaniaThailandTimor-LesteTogoTongaTrinidad and TobagoTunisiaTurkeyTurkmenistanTuvaluUgandaUkraineUnited Arab EmiratesUnited KingdomUnited StatesUpper middle incomeUruguayUzbekistanVanuatuVenezuela, RBVietnamWest Bank and GazaWorldYemen, Rep.ZambiaZimbabwe Timeline:
This timeline shows a graph from 1972 to 2015 of Congo, Dem. Rep.. No data until 1971. Number of actual observations by date: 30.
Source name:
World Development Indicators
Source organization:
United Nations Educational, Scientific, and Cultural Organization (UNESCO) Institute for Statistics.
Categories, topics:
Education, Gender
Last updated:
apr 23, 2017
Indicators value changes by year
Maximum:
33.329
jan 1, 2015
At the date of observation
Value
Absolute change
Change from previous value
jan 1, 1972
4.104
+4.104
0.0%
jan 1, 1973
4.987
+0.883
21.52%
jan 1, 1974
5.955
+0.967
19.4%
jan 1, 1975
6.396
+0.441
7.41%
jan 1, 1976
8.127
+1.731
27.07%
jan 1, 1977
8.969
+0.842
10.36%
jan 1, 1978
10.197
+1.227
13.68%
jan 1, 1979
11.639
+1.442
14.15%
jan 1, 1980
13.34
+1.701
14.62%
jan 1, 1981
13.363
+0.022
0.17%
jan 1, 1982
13.412
+0.049
0.37%
jan 1, 1983
13.546
+0.134
1.0%
jan 1, 1984
13.707
+0.161
1.19%
jan 1, 1985
13.882
+0.175
1.28%
jan 1, 1986
14.059
+0.177
1.27%
jan 1, 1987
14.239
+0.18
1.28%
jan 1, 1988
14.478
+0.239
1.68%
jan 1, 1989
16.272
+1.793
12.39%
jan 1, 1993
14.859
-1.412
-8.68%
jan 1, 1994
15.612
+0.752
5.06%
jan 1, 1995
15.912
+0.301
1.93%
jan 1, 1996
21.134
+5.221
32.81%
jan 1, 2008
24.389
+3.256
15.4%
jan 1, 2009
26.951
+2.562
10.5%
jan 1, 2010
28.518
+1.567
5.81%
jan 1, 2011
28.784
+0.266
0.93%
jan 1, 2012
30.601
+1.817
6.31%
jan 1, 2013
30.675
+0.074
0.24%
jan 1, 2014
31.359
+0.684
2.23%
jan 1, 2015
33.329
+1.97
6.28%
Ranking of countries by current statistics by years


Comments: