29
/
en
AIzaSyAYiBZKx7MnpbEhh9jyipgxe19OcubqV5w
April 1, 2024
277107
United States
USA
true
2
1
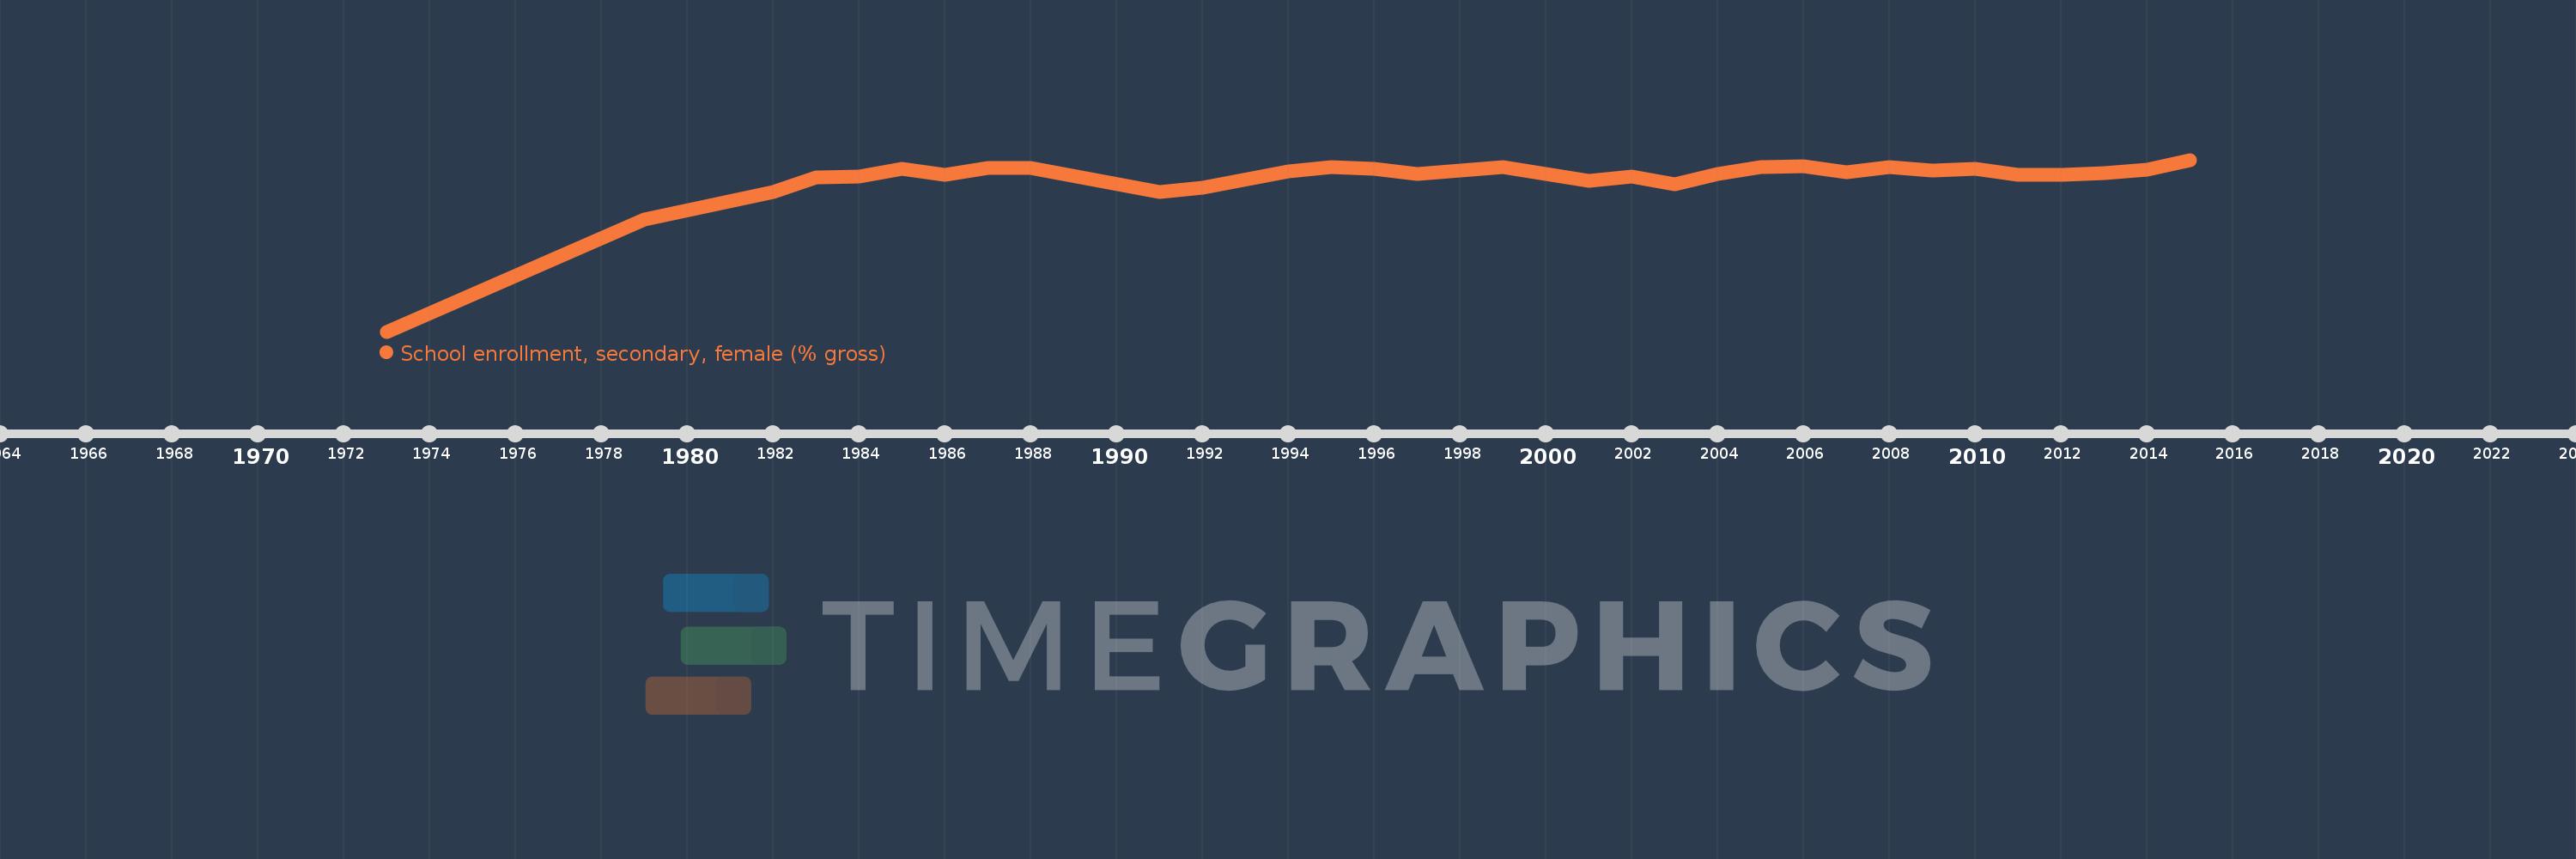
School enrollment, secondary, female (% gross)
2015,2014,2013,2012,2011,2010,2009,2008,2007,2006,2005,2004,2003,2002,2001,1999,1997,1996,1995,1994,1992,1991,1988,1987,1986,1985,1984,1983,1982,1979,1973
This statistics in other country:
AfghanistanAlbaniaAlgeriaAndorraAngolaAntigua and BarbudaArab WorldArgentinaArmeniaArubaAustraliaAustriaAzerbaijanBahamas, TheBahrainBangladeshBarbadosBelarusBelgiumBelizeBeninBermudaBhutanBoliviaBosnia and HerzegovinaBotswanaBrazilBrunei DarussalamBulgariaBurkina FasoBurundiCabo VerdeCambodiaCameroonCanadaCaribbean small statesCentral African RepublicCentral Europe and the BalticsChadChileChinaColombiaComorosCongo, Dem. Rep.Congo, Rep.Costa RicaCote d'IvoireCroatiaCubaCuracaoCyprusCzech RepublicDenmarkDjiboutiDominicaDominican RepublicEarly-demographic dividendEast Asia & PacificEast Asia & Pacific (excluding high income)East Asia & Pacific (IDA & IBRD countries)EcuadorEgypt, Arab Rep.El SalvadorEquatorial GuineaEritreaEstoniaEthiopiaEuro areaEurope & Central AsiaEurope & Central Asia (excluding high income)Europe & Central Asia (IDA & IBRD countries)European UnionFijiFinlandFragile and conflict affected situationsFranceGabonGambia, TheGeorgiaGermanyGhanaGreeceGrenadaGuatemalaGuineaGuinea-BissauGuyanaHeavily indebted poor countries (HIPC)High incomeHondurasHong Kong SAR, ChinaHungaryIBRD onlyIcelandIDA & IBRD totalIDA blendIDA onlyIDA totalIndiaIndonesiaIran, Islamic Rep.IraqIrelandIsraelItalyJamaicaJapanJordanKazakhstanKenyaKiribatiKorea, Dem. People’s Rep.Korea, Rep.KuwaitKyrgyz RepublicLao PDRLate-demographic dividendLatin America & Caribbean Latin America & Caribbean (excluding high income)Latin America & the Caribbean (IDA & IBRD countries)LatviaLeast developed countries: UN classificationLebanonLesothoLiberiaLibyaLiechtensteinLithuaniaLow & middle incomeLow incomeLower middle incomeLuxembourgMacao SAR, ChinaMacedonia, FYRMadagascarMalawiMaldivesMaliMaltaMarshall IslandsMauritaniaMauritiusMexicoMicronesia, Fed. Sts.Middle East & North AfricaMiddle East & North Africa (excluding high income)Middle East & North Africa (IDA & IBRD countries)Middle incomeMoldovaMongoliaMontenegroMoroccoMozambiqueMyanmarNamibiaNauruNepalNetherlandsNew ZealandNicaraguaNigerNigeriaNorth AmericaNorwayOECD membersOmanOther small statesPacific island small statesPakistanPalauPanamaPapua New GuineaParaguayPeruPhilippinesPolandPortugalPost-demographic dividendPre-demographic dividendPuerto RicoQatarRomaniaRussian FederationRwandaSamoaSan MarinoSao Tome and PrincipeSaudi ArabiaSenegalSerbiaSeychellesSierra LeoneSlovak RepublicSloveniaSmall statesSolomon IslandsSomaliaSouth AfricaSouth AsiaSouth Asia (IDA & IBRD)SpainSri LankaSt. Kitts and NevisSt. LuciaSt. Vincent and the GrenadinesSub-Saharan Africa Sub-Saharan Africa (excluding high income)Sub-Saharan Africa (IDA & IBRD countries)SudanSurinameSwazilandSwedenSwitzerlandSyrian Arab RepublicTajikistanTanzaniaThailandTimor-LesteTogoTongaTrinidad and TobagoTunisiaTurkeyTurkmenistanTuvaluUgandaUkraineUnited Arab EmiratesUnited KingdomUnited StatesUpper middle incomeUruguayUzbekistanVanuatuVenezuela, RBVietnamWest Bank and GazaWorldYemen, Rep.ZambiaZimbabwe Timeline:
This timeline shows a graph from 1973 to 2015 of United States. No data until 1972. Number of actual observations by date: 31.
Source name:
World Development Indicators
Source organization:
United Nations Educational, Scientific, and Cultural Organization (UNESCO) Institute for Statistics.
Categories, topics:
Education, Gender
Last updated:
apr 23, 2017
Indicators value changes by year
Minimum:
60.672
jan 1, 1973
Maximum:
98.473
jan 1, 2015
At the date of observation
Value
Absolute change
Change from previous value
jan 1, 1973
60.672
+60.672
0.0%
jan 1, 1979
85.393
+24.721
40.74%
jan 1, 1982
91.417
+6.024
7.05%
jan 1, 1983
94.675
+3.258
3.56%
jan 1, 1984
94.754
+0.079
0.08%
jan 1, 1985
96.462
+1.708
1.8%
jan 1, 1986
95.077
-1.385
-1.44%
jan 1, 1987
96.608
+1.531
1.61%
jan 1, 1988
96.643
+0.035
0.04%
jan 1, 1991
91.472
-5.171
-5.35%
jan 1, 1992
92.257
+0.785
0.86%
jan 1, 1994
95.99
+3.733
4.05%
jan 1, 1995
96.811
+0.821
0.86%
jan 1, 1996
96.407
-0.404
-0.42%
jan 1, 1997
95.26
-1.147
-1.19%
jan 1, 1999
96.922
+1.662
1.74%
jan 1, 2001
93.883
-3.039
-3.14%
jan 1, 2002
94.772
+0.889
0.95%
jan 1, 2003
93.059
-1.714
-1.81%
jan 1, 2004
95.391
+2.332
2.51%
jan 1, 2005
96.896
+1.506
1.58%
jan 1, 2006
97.064
+0.168
0.17%
jan 1, 2007
95.64
-1.424
-1.47%
jan 1, 2008
96.828
+1.188
1.24%
jan 1, 2009
96.105
-0.723
-0.75%
jan 1, 2010
96.431
+0.326
0.34%
jan 1, 2011
95.166
-1.265
-1.31%
jan 1, 2012
95.255
+0.089
0.09%
jan 1, 2013
95.587
+0.332
0.35%
jan 1, 2014
96.374
+0.787
0.82%
jan 1, 2015
98.473
+2.099
2.18%
Ranking of countries by current statistics by years


Comments: