29
/
en
AIzaSyAYiBZKx7MnpbEhh9jyipgxe19OcubqV5w
April 1, 2024
43863
Latin America & the Caribbean (IDA & IBRD countries)
TLA
false
2
1
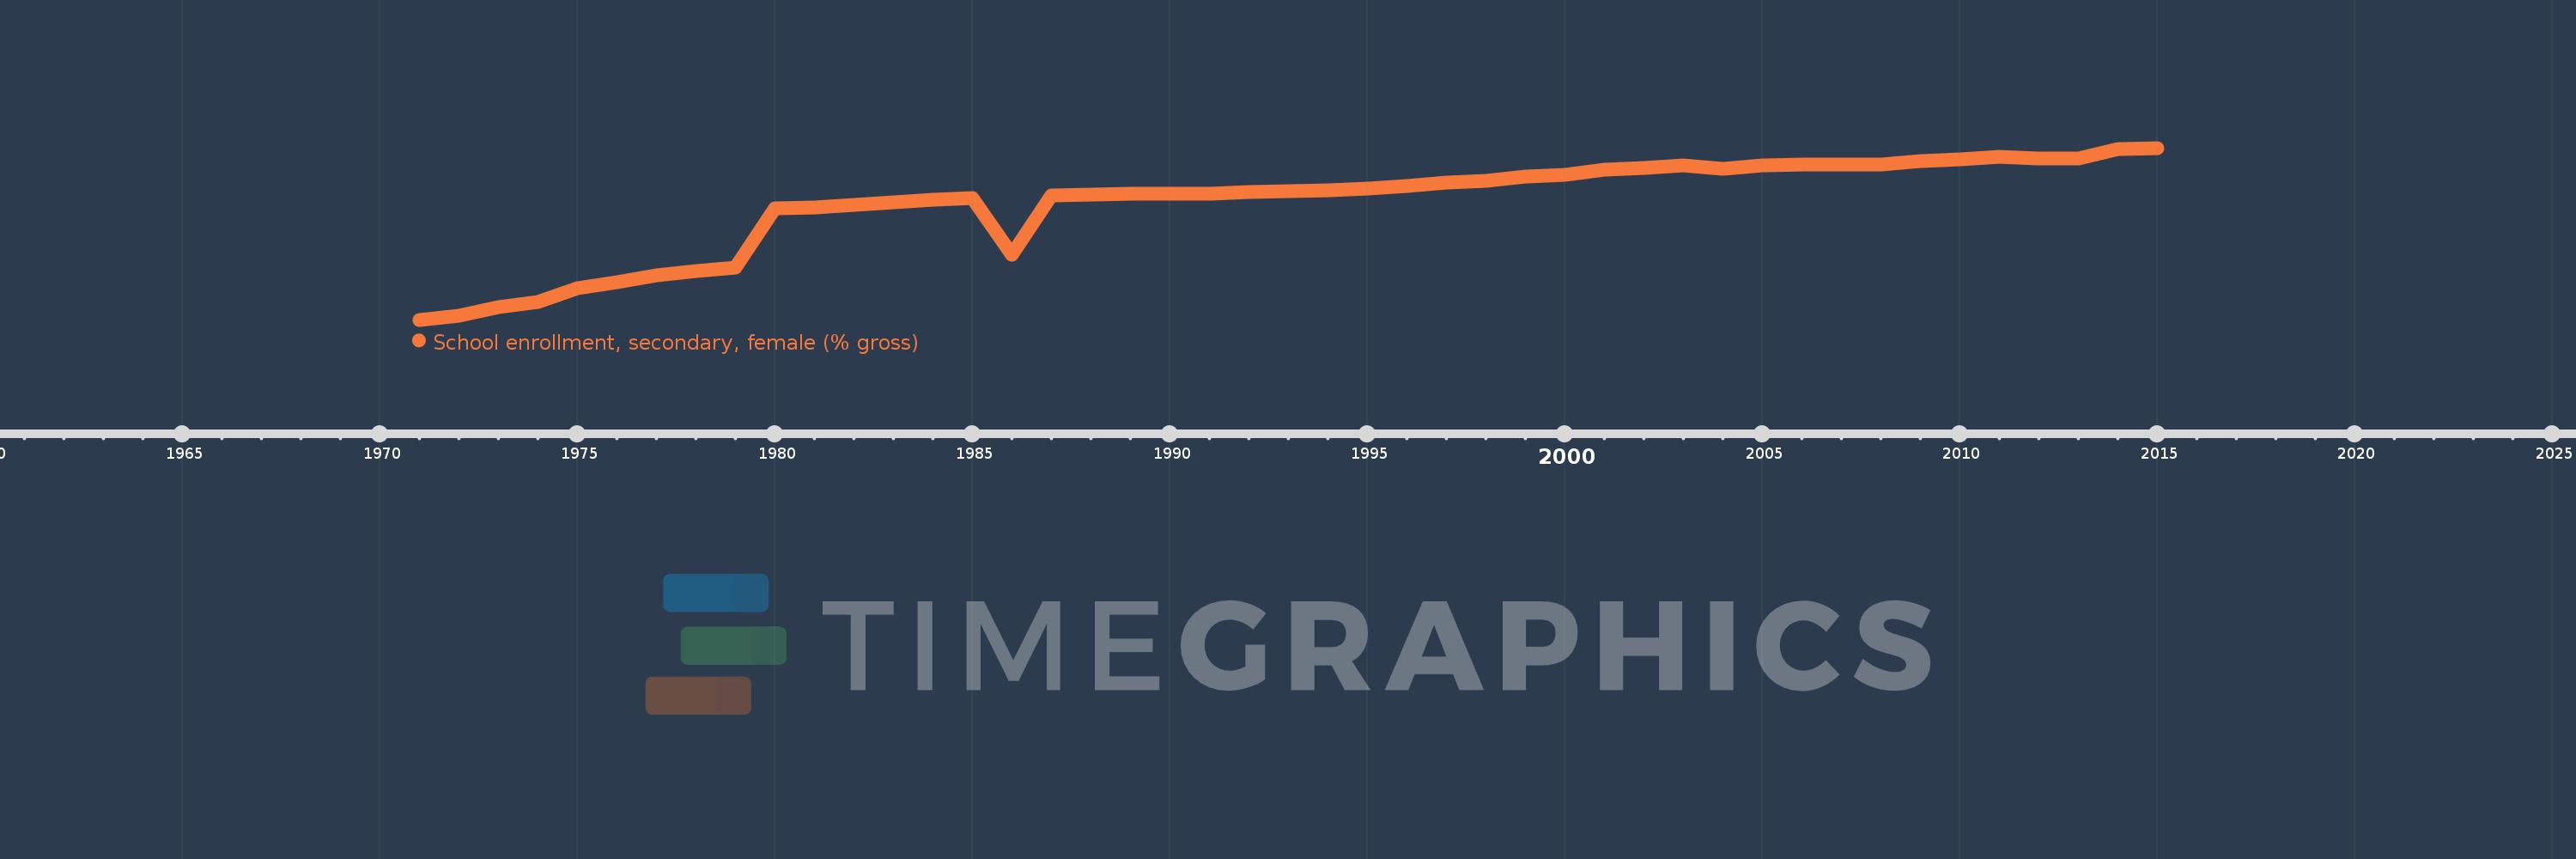
School enrollment, secondary, female (% gross)
2015,2014,2013,2012,2011,2010,2009,2008,2007,2006,2005,2004,2003,2002,2001,2000,1999,1998,1997,1996,1995,1994,1993,1992,1991,1990,1989,1988,1987,1986,1985,1984,1983,1982,1981,1980,1979,1978,1977,1976,1975,1974,1973,1972,1971
This statistics in other country:
AfghanistanAlbaniaAlgeriaAndorraAngolaAntigua and BarbudaArab WorldArgentinaArmeniaArubaAustraliaAustriaAzerbaijanBahamas, TheBahrainBangladeshBarbadosBelarusBelgiumBelizeBeninBermudaBhutanBoliviaBosnia and HerzegovinaBotswanaBrazilBrunei DarussalamBulgariaBurkina FasoBurundiCabo VerdeCambodiaCameroonCanadaCaribbean small statesCentral African RepublicCentral Europe and the BalticsChadChileChinaColombiaComorosCongo, Dem. Rep.Congo, Rep.Costa RicaCote d'IvoireCroatiaCubaCuracaoCyprusCzech RepublicDenmarkDjiboutiDominicaDominican RepublicEarly-demographic dividendEast Asia & PacificEast Asia & Pacific (excluding high income)East Asia & Pacific (IDA & IBRD countries)EcuadorEgypt, Arab Rep.El SalvadorEquatorial GuineaEritreaEstoniaEthiopiaEuro areaEurope & Central AsiaEurope & Central Asia (excluding high income)Europe & Central Asia (IDA & IBRD countries)European UnionFijiFinlandFragile and conflict affected situationsFranceGabonGambia, TheGeorgiaGermanyGhanaGreeceGrenadaGuatemalaGuineaGuinea-BissauGuyanaHeavily indebted poor countries (HIPC)High incomeHondurasHong Kong SAR, ChinaHungaryIBRD onlyIcelandIDA & IBRD totalIDA blendIDA onlyIDA totalIndiaIndonesiaIran, Islamic Rep.IraqIrelandIsraelItalyJamaicaJapanJordanKazakhstanKenyaKiribatiKorea, Dem. People’s Rep.Korea, Rep.KuwaitKyrgyz RepublicLao PDRLate-demographic dividendLatin America & Caribbean Latin America & Caribbean (excluding high income)Latin America & the Caribbean (IDA & IBRD countries)LatviaLeast developed countries: UN classificationLebanonLesothoLiberiaLibyaLiechtensteinLithuaniaLow & middle incomeLow incomeLower middle incomeLuxembourgMacao SAR, ChinaMacedonia, FYRMadagascarMalawiMaldivesMaliMaltaMarshall IslandsMauritaniaMauritiusMexicoMicronesia, Fed. Sts.Middle East & North AfricaMiddle East & North Africa (excluding high income)Middle East & North Africa (IDA & IBRD countries)Middle incomeMoldovaMongoliaMontenegroMoroccoMozambiqueMyanmarNamibiaNauruNepalNetherlandsNew ZealandNicaraguaNigerNigeriaNorth AmericaNorwayOECD membersOmanOther small statesPacific island small statesPakistanPalauPanamaPapua New GuineaParaguayPeruPhilippinesPolandPortugalPost-demographic dividendPre-demographic dividendPuerto RicoQatarRomaniaRussian FederationRwandaSamoaSan MarinoSao Tome and PrincipeSaudi ArabiaSenegalSerbiaSeychellesSierra LeoneSlovak RepublicSloveniaSmall statesSolomon IslandsSomaliaSouth AfricaSouth AsiaSouth Asia (IDA & IBRD)SpainSri LankaSt. Kitts and NevisSt. LuciaSt. Vincent and the GrenadinesSub-Saharan Africa Sub-Saharan Africa (excluding high income)Sub-Saharan Africa (IDA & IBRD countries)SudanSurinameSwazilandSwedenSwitzerlandSyrian Arab RepublicTajikistanTanzaniaThailandTimor-LesteTogoTongaTrinidad and TobagoTunisiaTurkeyTurkmenistanTuvaluUgandaUkraineUnited Arab EmiratesUnited KingdomUnited StatesUpper middle incomeUruguayUzbekistanVanuatuVenezuela, RBVietnamWest Bank and GazaWorldYemen, Rep.ZambiaZimbabwe Timeline:
This timeline shows a graph from 1971 to 2015 of Latin America & the Caribbean (IDA & IBRD countries). No data until 1970. Number of actual observations by date: 45.
Source name:
World Development Indicators
Source organization:
United Nations Educational, Scientific, and Cultural Organization (UNESCO) Institute for Statistics.
Categories, topics:
Education, Gender
Last updated:
apr 23, 2017
Indicators value changes by year
Minimum:
26.059
jan 1, 1971
Maximum:
97.215
jan 1, 2015
At the date of observation
Value
Absolute change
Change from previous value
jan 1, 1971
26.059
+26.059
0.0%
jan 1, 1972
27.759
+1.7
6.52%
jan 1, 1973
31.249
+3.49
12.57%
jan 1, 1974
33.469
+2.221
7.11%
jan 1, 1975
38.981
+5.512
16.47%
jan 1, 1976
41.651
+2.67
6.85%
jan 1, 1977
44.342
+2.69
6.46%
jan 1, 1978
46.095
+1.754
3.95%
jan 1, 1979
47.52
+1.424
3.09%
jan 1, 1980
72.192
+24.672
51.92%
jan 1, 1981
72.704
+0.512
0.71%
jan 1, 1982
73.774
+1.07
1.47%
jan 1, 1983
74.676
+0.902
1.22%
jan 1, 1984
75.633
+0.956
1.28%
jan 1, 1985
76.42
+0.787
1.04%
jan 1, 1986
52.847
-23.572
-30.85%
jan 1, 1987
77.701
+24.854
47.03%
jan 1, 1988
77.861
+0.159
0.2%
jan 1, 1989
78.083
+0.223
0.29%
jan 1, 1990
78.147
+0.064
0.08%
jan 1, 1991
78.252
+0.105
0.13%
jan 1, 1992
78.929
+0.677
0.87%
jan 1, 1993
79.47
+0.541
0.69%
jan 1, 1994
79.586
+0.116
0.15%
jan 1, 1995
80.427
+0.841
1.06%
jan 1, 1996
81.585
+1.159
1.44%
jan 1, 1997
82.719
+1.134
1.39%
jan 1, 1998
83.467
+0.747
0.9%
jan 1, 1999
85.411
+1.944
2.33%
jan 1, 2000
86.237
+0.827
0.97%
jan 1, 2001
88.246
+2.009
2.33%
jan 1, 2002
88.792
+0.546
0.62%
jan 1, 2003
90.136
+1.345
1.51%
jan 1, 2004
88.659
-1.477
-1.64%
jan 1, 2005
89.84
+1.18
1.33%
jan 1, 2006
90.29
+0.451
0.5%
jan 1, 2007
90.207
-0.083
-0.09%
jan 1, 2008
90.412
+0.205
0.23%
jan 1, 2009
91.849
+1.437
1.59%
jan 1, 2010
92.468
+0.619
0.67%
jan 1, 2011
93.474
+1.006
1.09%
jan 1, 2012
92.788
-0.685
-0.73%
jan 1, 2013
92.815
+0.027
0.03%
jan 1, 2014
96.74
+3.925
4.23%
jan 1, 2015
97.215
+0.476
0.49%
Ranking of countries by current statistics by years


Comments: