29
/
en
AIzaSyAYiBZKx7MnpbEhh9jyipgxe19OcubqV5w
April 1, 2024
117393
Cyprus
CYP
true
2
1
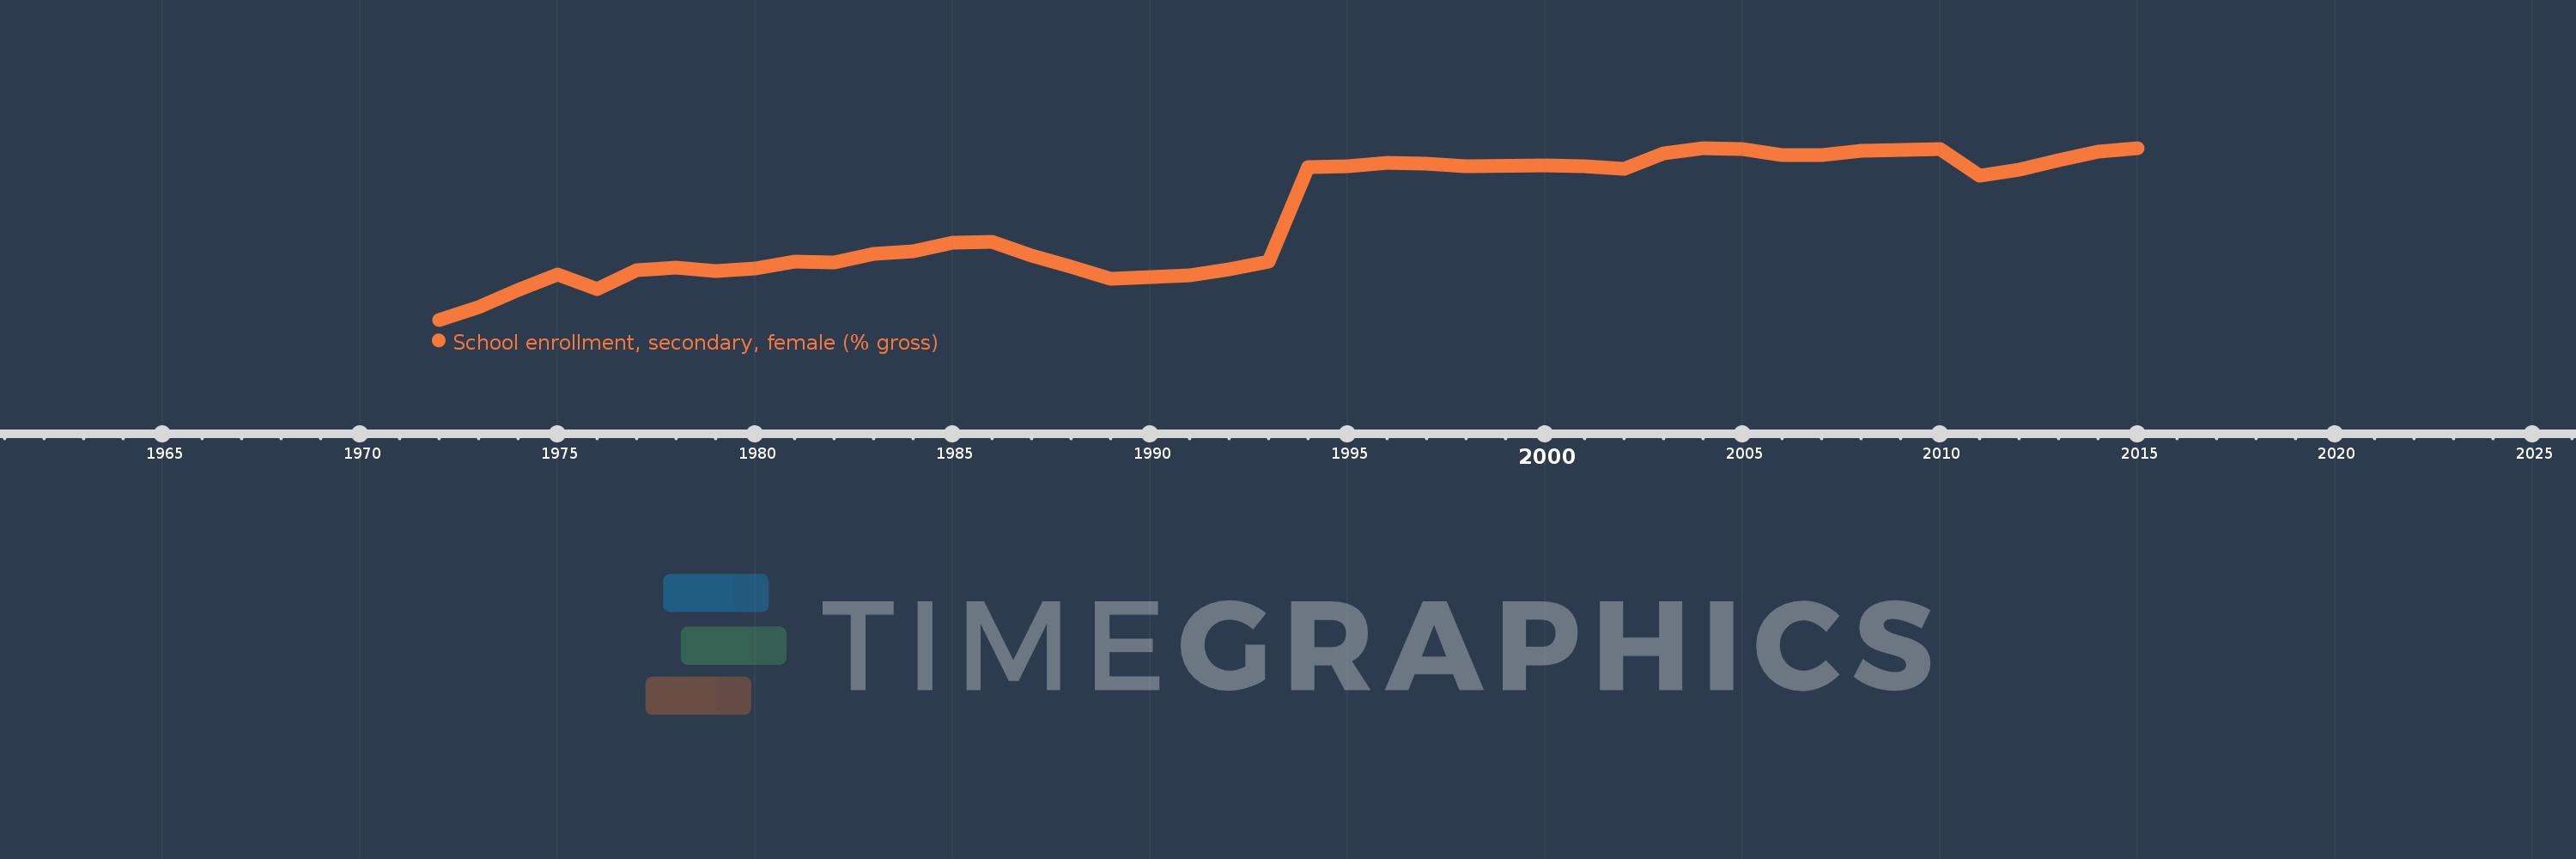
School enrollment, secondary, female (% gross)
2015,2014,2013,2012,2011,2010,2009,2008,2007,2006,2005,2004,2003,2002,2001,2000,1998,1997,1996,1995,1994,1993,1992,1991,1990,1989,1988,1987,1986,1985,1984,1983,1982,1981,1980,1979,1978,1977,1976,1975,1974,1973,1972
This statistics in other country:
AfghanistanAlbaniaAlgeriaAndorraAngolaAntigua and BarbudaArab WorldArgentinaArmeniaArubaAustraliaAustriaAzerbaijanBahamas, TheBahrainBangladeshBarbadosBelarusBelgiumBelizeBeninBermudaBhutanBoliviaBosnia and HerzegovinaBotswanaBrazilBrunei DarussalamBulgariaBurkina FasoBurundiCabo VerdeCambodiaCameroonCanadaCaribbean small statesCentral African RepublicCentral Europe and the BalticsChadChileChinaColombiaComorosCongo, Dem. Rep.Congo, Rep.Costa RicaCote d'IvoireCroatiaCubaCuracaoCyprusCzech RepublicDenmarkDjiboutiDominicaDominican RepublicEarly-demographic dividendEast Asia & PacificEast Asia & Pacific (excluding high income)East Asia & Pacific (IDA & IBRD countries)EcuadorEgypt, Arab Rep.El SalvadorEquatorial GuineaEritreaEstoniaEthiopiaEuro areaEurope & Central AsiaEurope & Central Asia (excluding high income)Europe & Central Asia (IDA & IBRD countries)European UnionFijiFinlandFragile and conflict affected situationsFranceGabonGambia, TheGeorgiaGermanyGhanaGreeceGrenadaGuatemalaGuineaGuinea-BissauGuyanaHeavily indebted poor countries (HIPC)High incomeHondurasHong Kong SAR, ChinaHungaryIBRD onlyIcelandIDA & IBRD totalIDA blendIDA onlyIDA totalIndiaIndonesiaIran, Islamic Rep.IraqIrelandIsraelItalyJamaicaJapanJordanKazakhstanKenyaKiribatiKorea, Dem. People’s Rep.Korea, Rep.KuwaitKyrgyz RepublicLao PDRLate-demographic dividendLatin America & Caribbean Latin America & Caribbean (excluding high income)Latin America & the Caribbean (IDA & IBRD countries)LatviaLeast developed countries: UN classificationLebanonLesothoLiberiaLibyaLiechtensteinLithuaniaLow & middle incomeLow incomeLower middle incomeLuxembourgMacao SAR, ChinaMacedonia, FYRMadagascarMalawiMaldivesMaliMaltaMarshall IslandsMauritaniaMauritiusMexicoMicronesia, Fed. Sts.Middle East & North AfricaMiddle East & North Africa (excluding high income)Middle East & North Africa (IDA & IBRD countries)Middle incomeMoldovaMongoliaMontenegroMoroccoMozambiqueMyanmarNamibiaNauruNepalNetherlandsNew ZealandNicaraguaNigerNigeriaNorth AmericaNorwayOECD membersOmanOther small statesPacific island small statesPakistanPalauPanamaPapua New GuineaParaguayPeruPhilippinesPolandPortugalPost-demographic dividendPre-demographic dividendPuerto RicoQatarRomaniaRussian FederationRwandaSamoaSan MarinoSao Tome and PrincipeSaudi ArabiaSenegalSerbiaSeychellesSierra LeoneSlovak RepublicSloveniaSmall statesSolomon IslandsSomaliaSouth AfricaSouth AsiaSouth Asia (IDA & IBRD)SpainSri LankaSt. Kitts and NevisSt. LuciaSt. Vincent and the GrenadinesSub-Saharan Africa Sub-Saharan Africa (excluding high income)Sub-Saharan Africa (IDA & IBRD countries)SudanSurinameSwazilandSwedenSwitzerlandSyrian Arab RepublicTajikistanTanzaniaThailandTimor-LesteTogoTongaTrinidad and TobagoTunisiaTurkeyTurkmenistanTuvaluUgandaUkraineUnited Arab EmiratesUnited KingdomUnited StatesUpper middle incomeUruguayUzbekistanVanuatuVenezuela, RBVietnamWest Bank and GazaWorldYemen, Rep.ZambiaZimbabwe Timeline:
This timeline shows a graph from 1972 to 2015 of Cyprus. No data until 1971. Number of actual observations by date: 43.
Source name:
World Development Indicators
Source organization:
United Nations Educational, Scientific, and Cultural Organization (UNESCO) Institute for Statistics.
Categories, topics:
Education, Gender
Last updated:
apr 23, 2017
Indicators value changes by year
Minimum:
53.018
jan 1, 1972
Maximum:
99.456
jan 1, 2015
At the date of observation
Value
Absolute change
Change from previous value
jan 1, 1972
53.018
+53.018
0.0%
jan 1, 1973
56.522
+3.505
6.61%
jan 1, 1974
61.177
+4.654
8.23%
jan 1, 1975
65.149
+3.973
6.49%
jan 1, 1976
61.266
-3.884
-5.96%
jan 1, 1977
66.484
+5.218
8.52%
jan 1, 1978
67.18
+0.696
1.05%
jan 1, 1979
66.118
-1.062
-1.58%
jan 1, 1980
66.836
+0.718
1.09%
jan 1, 1981
68.699
+1.863
2.79%
jan 1, 1982
68.488
-0.211
-0.31%
jan 1, 1983
70.74
+2.251
3.29%
jan 1, 1984
71.572
+0.832
1.18%
jan 1, 1985
73.902
+2.331
3.26%
jan 1, 1986
74.106
+0.204
0.28%
jan 1, 1987
70.349
-3.757
-5.07%
jan 1, 1988
67.384
-2.965
-4.22%
jan 1, 1989
63.994
-3.389
-5.03%
jan 1, 1990
64.566
+0.572
0.89%
jan 1, 1991
65.127
+0.561
0.87%
jan 1, 1992
66.631
+1.505
2.31%
jan 1, 1993
68.821
+2.189
3.29%
jan 1, 1994
94.273
+25.452
36.98%
jan 1, 1995
94.429
+0.156
0.17%
jan 1, 1996
95.425
+0.996
1.06%
jan 1, 1997
95.266
-0.16
-0.17%
jan 1, 1998
94.493
-0.773
-0.81%
jan 1, 2000
94.686
+0.193
0.2%
jan 1, 2001
94.44
-0.246
-0.26%
jan 1, 2002
93.9
-0.54
-0.57%
jan 1, 2003
97.981
+4.081
4.35%
jan 1, 2004
99.276
+1.295
1.32%
jan 1, 2005
99.077
-0.199
-0.2%
jan 1, 2006
97.479
-1.598
-1.61%
jan 1, 2007
97.435
-0.044
-0.05%
jan 1, 2008
98.694
+1.259
1.29%
jan 1, 2009
98.886
+0.192
0.19%
jan 1, 2010
99.047
+0.161
0.16%
jan 1, 2011
91.994
-7.053
-7.12%
jan 1, 2012
93.533
+1.539
1.67%
jan 1, 2013
96.186
+2.654
2.84%
jan 1, 2014
98.527
+2.34
2.43%
jan 1, 2015
99.456
+0.929
0.94%
Ranking of countries by current statistics by years


Comments: