29
/
en
AIzaSyAYiBZKx7MnpbEhh9jyipgxe19OcubqV5w
April 1, 2024
225370
Poland
POL
true
2
1
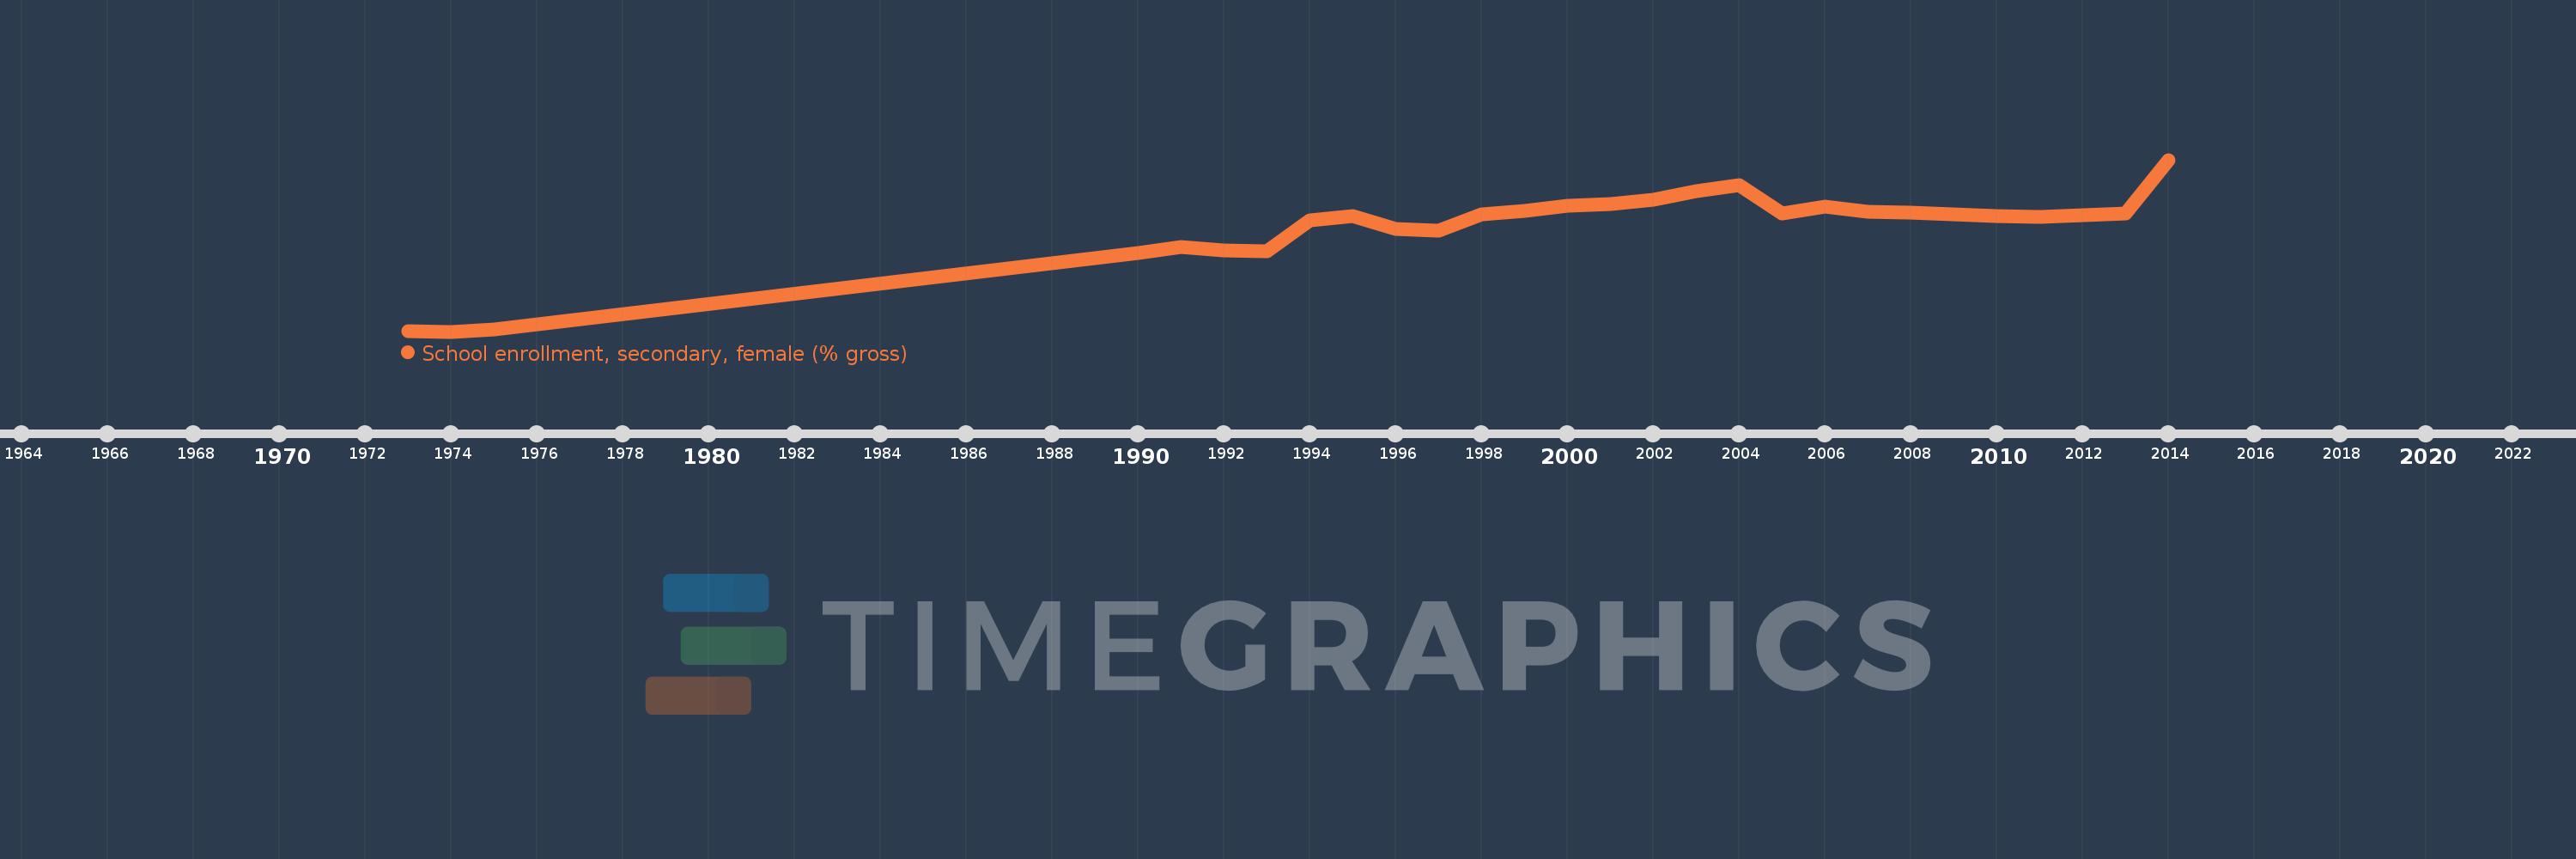
School enrollment, secondary, female (% gross)
2014,2013,2012,2011,2010,2009,2008,2007,2006,2005,2004,2003,2002,2001,2000,1999,1998,1997,1996,1995,1994,1993,1992,1991,1990,1975,1974,1973
This statistics in other country:
AfghanistanAlbaniaAlgeriaAndorraAngolaAntigua and BarbudaArab WorldArgentinaArmeniaArubaAustraliaAustriaAzerbaijanBahamas, TheBahrainBangladeshBarbadosBelarusBelgiumBelizeBeninBermudaBhutanBoliviaBosnia and HerzegovinaBotswanaBrazilBrunei DarussalamBulgariaBurkina FasoBurundiCabo VerdeCambodiaCameroonCanadaCaribbean small statesCentral African RepublicCentral Europe and the BalticsChadChileChinaColombiaComorosCongo, Dem. Rep.Congo, Rep.Costa RicaCote d'IvoireCroatiaCubaCuracaoCyprusCzech RepublicDenmarkDjiboutiDominicaDominican RepublicEarly-demographic dividendEast Asia & PacificEast Asia & Pacific (excluding high income)East Asia & Pacific (IDA & IBRD countries)EcuadorEgypt, Arab Rep.El SalvadorEquatorial GuineaEritreaEstoniaEthiopiaEuro areaEurope & Central AsiaEurope & Central Asia (excluding high income)Europe & Central Asia (IDA & IBRD countries)European UnionFijiFinlandFragile and conflict affected situationsFranceGabonGambia, TheGeorgiaGermanyGhanaGreeceGrenadaGuatemalaGuineaGuinea-BissauGuyanaHeavily indebted poor countries (HIPC)High incomeHondurasHong Kong SAR, ChinaHungaryIBRD onlyIcelandIDA & IBRD totalIDA blendIDA onlyIDA totalIndiaIndonesiaIran, Islamic Rep.IraqIrelandIsraelItalyJamaicaJapanJordanKazakhstanKenyaKiribatiKorea, Dem. People’s Rep.Korea, Rep.KuwaitKyrgyz RepublicLao PDRLate-demographic dividendLatin America & Caribbean Latin America & Caribbean (excluding high income)Latin America & the Caribbean (IDA & IBRD countries)LatviaLeast developed countries: UN classificationLebanonLesothoLiberiaLibyaLiechtensteinLithuaniaLow & middle incomeLow incomeLower middle incomeLuxembourgMacao SAR, ChinaMacedonia, FYRMadagascarMalawiMaldivesMaliMaltaMarshall IslandsMauritaniaMauritiusMexicoMicronesia, Fed. Sts.Middle East & North AfricaMiddle East & North Africa (excluding high income)Middle East & North Africa (IDA & IBRD countries)Middle incomeMoldovaMongoliaMontenegroMoroccoMozambiqueMyanmarNamibiaNauruNepalNetherlandsNew ZealandNicaraguaNigerNigeriaNorth AmericaNorwayOECD membersOmanOther small statesPacific island small statesPakistanPalauPanamaPapua New GuineaParaguayPeruPhilippinesPolandPortugalPost-demographic dividendPre-demographic dividendPuerto RicoQatarRomaniaRussian FederationRwandaSamoaSan MarinoSao Tome and PrincipeSaudi ArabiaSenegalSerbiaSeychellesSierra LeoneSlovak RepublicSloveniaSmall statesSolomon IslandsSomaliaSouth AfricaSouth AsiaSouth Asia (IDA & IBRD)SpainSri LankaSt. Kitts and NevisSt. LuciaSt. Vincent and the GrenadinesSub-Saharan Africa Sub-Saharan Africa (excluding high income)Sub-Saharan Africa (IDA & IBRD countries)SudanSurinameSwazilandSwedenSwitzerlandSyrian Arab RepublicTajikistanTanzaniaThailandTimor-LesteTogoTongaTrinidad and TobagoTunisiaTurkeyTurkmenistanTuvaluUgandaUkraineUnited Arab EmiratesUnited KingdomUnited StatesUpper middle incomeUruguayUzbekistanVanuatuVenezuela, RBVietnamWest Bank and GazaWorldYemen, Rep.ZambiaZimbabwe Timeline:
This timeline shows a graph from 1973 to 2014 of Poland. No data until 1972. Number of actual observations by date: 28.
Source name:
World Development Indicators
Source organization:
United Nations Educational, Scientific, and Cultural Organization (UNESCO) Institute for Statistics.
Categories, topics:
Education, Gender
Last updated:
apr 23, 2017
Indicators value changes by year
Minimum:
75.056
jan 1, 1974
Maximum:
106.712
jan 1, 2014
At the date of observation
Value
Absolute change
Change from previous value
jan 1, 1973
75.117
+75.117
0.0%
jan 1, 1974
75.056
-0.061
-0.08%
jan 1, 1975
75.433
+0.377
0.5%
jan 1, 1990
89.587
+14.154
18.76%
jan 1, 1991
90.65
+1.063
1.19%
jan 1, 1992
89.935
-0.715
-0.79%
jan 1, 1993
89.84
-0.095
-0.11%
jan 1, 1994
95.632
+5.793
6.45%
jan 1, 1995
96.289
+0.657
0.69%
jan 1, 1996
93.948
-2.341
-2.43%
jan 1, 1997
93.658
-0.29
-0.31%
jan 1, 1998
96.721
+3.062
3.27%
jan 1, 1999
97.325
+0.605
0.63%
jan 1, 2000
98.207
+0.882
0.91%
jan 1, 2001
98.557
+0.35
0.36%
jan 1, 2002
99.389
+0.832
0.84%
jan 1, 2003
100.95
+1.561
1.57%
jan 1, 2004
102.12
+1.17
1.16%
jan 1, 2005
96.824
-5.296
-5.19%
jan 1, 2006
98.056
+1.231
1.27%
jan 1, 2007
97.109
-0.947
-0.97%
jan 1, 2008
96.972
-0.137
-0.14%
jan 1, 2009
96.701
-0.271
-0.28%
jan 1, 2010
96.282
-0.419
-0.43%
jan 1, 2011
96.228
-0.054
-0.06%
jan 1, 2012
96.451
+0.223
0.23%
jan 1, 2013
96.852
+0.401
0.42%
jan 1, 2014
106.712
+9.86
10.18%
Ranking of countries by current statistics by years


Comments: