29
/
en
AIzaSyAYiBZKx7MnpbEhh9jyipgxe19OcubqV5w
April 1, 2024
24505
Arab World
ARB
false
2
1
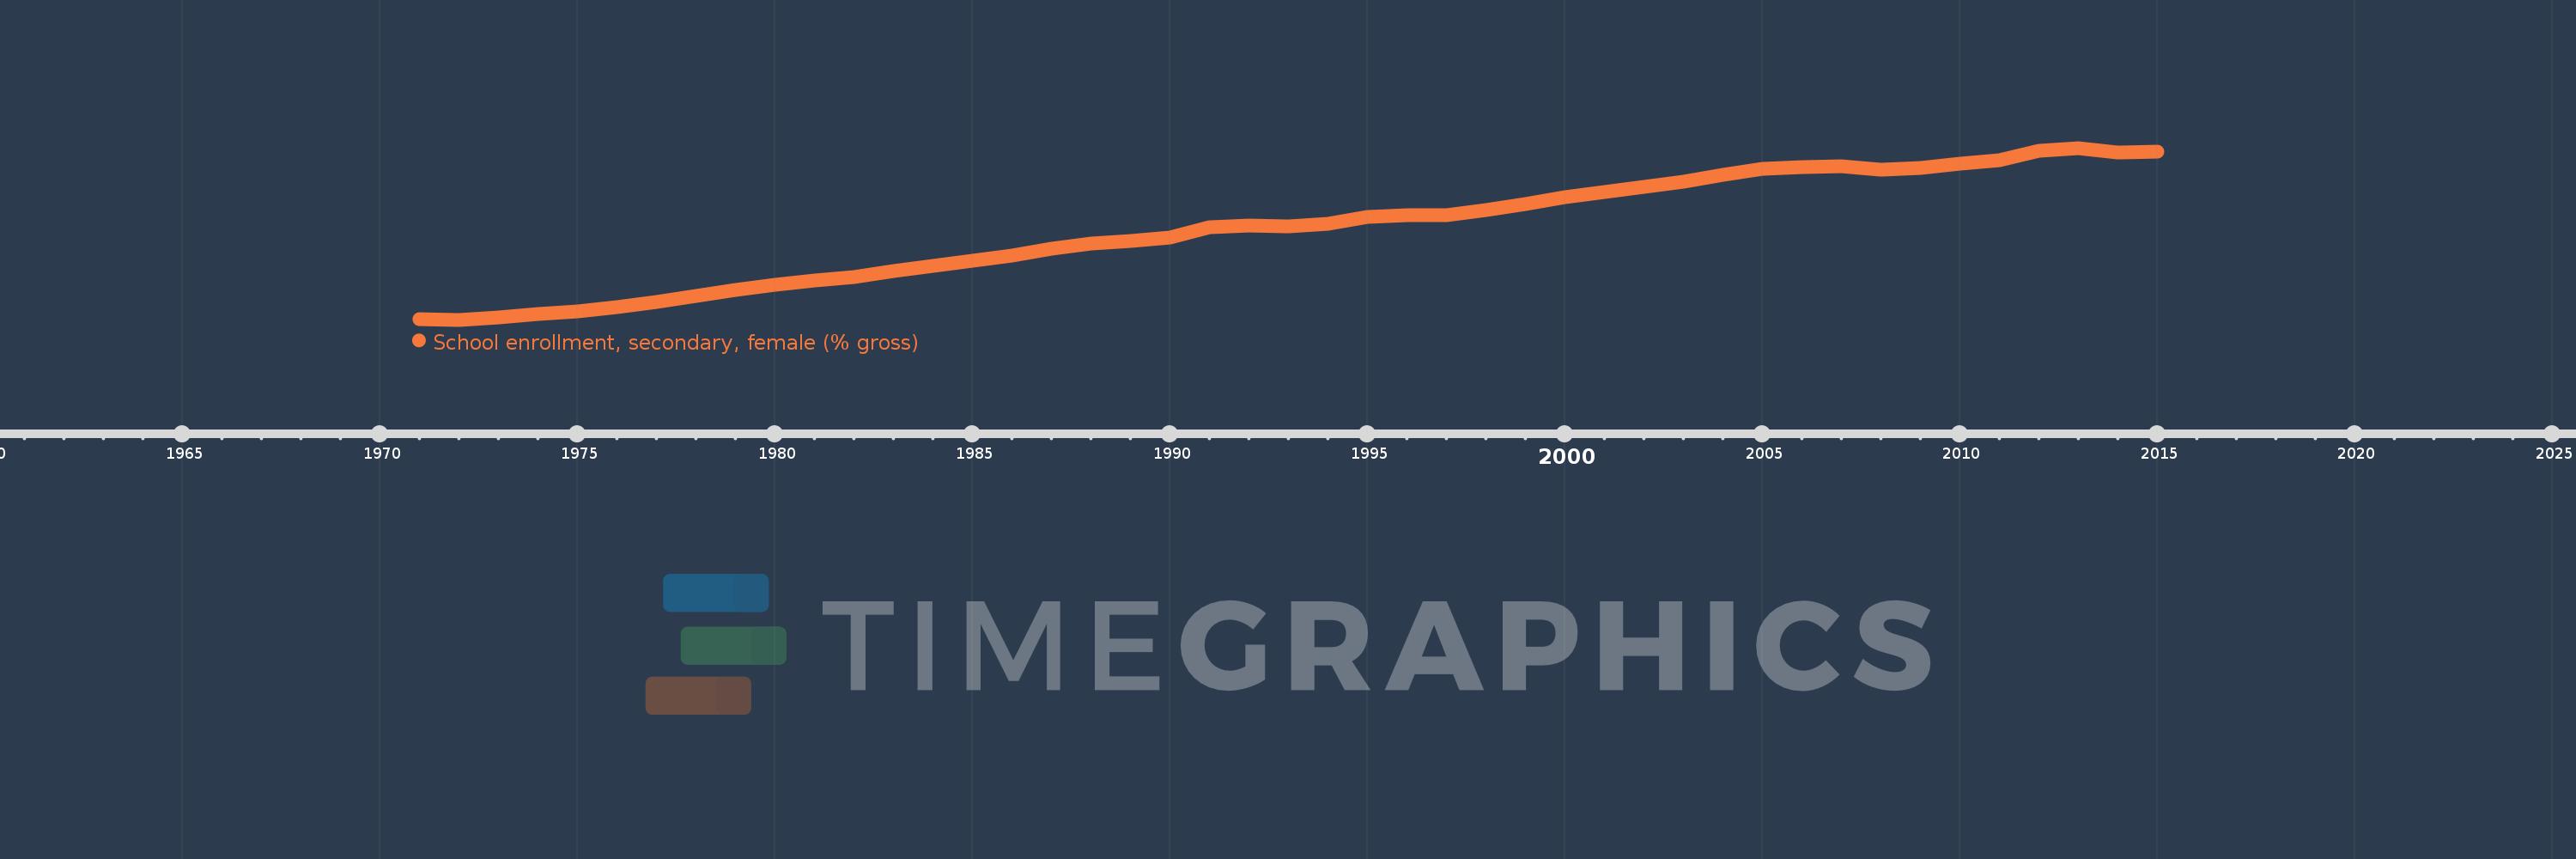
School enrollment, secondary, female (% gross)
2015,2014,2013,2012,2011,2010,2009,2008,2007,2006,2005,2004,2003,2002,2001,2000,1999,1998,1997,1996,1995,1994,1993,1992,1991,1990,1989,1988,1987,1986,1985,1984,1983,1982,1981,1980,1979,1978,1977,1976,1975,1974,1973,1972,1971
This statistics in other country:
AfghanistanAlbaniaAlgeriaAndorraAngolaAntigua and BarbudaArab WorldArgentinaArmeniaArubaAustraliaAustriaAzerbaijanBahamas, TheBahrainBangladeshBarbadosBelarusBelgiumBelizeBeninBermudaBhutanBoliviaBosnia and HerzegovinaBotswanaBrazilBrunei DarussalamBulgariaBurkina FasoBurundiCabo VerdeCambodiaCameroonCanadaCaribbean small statesCentral African RepublicCentral Europe and the BalticsChadChileChinaColombiaComorosCongo, Dem. Rep.Congo, Rep.Costa RicaCote d'IvoireCroatiaCubaCuracaoCyprusCzech RepublicDenmarkDjiboutiDominicaDominican RepublicEarly-demographic dividendEast Asia & PacificEast Asia & Pacific (excluding high income)East Asia & Pacific (IDA & IBRD countries)EcuadorEgypt, Arab Rep.El SalvadorEquatorial GuineaEritreaEstoniaEthiopiaEuro areaEurope & Central AsiaEurope & Central Asia (excluding high income)Europe & Central Asia (IDA & IBRD countries)European UnionFijiFinlandFragile and conflict affected situationsFranceGabonGambia, TheGeorgiaGermanyGhanaGreeceGrenadaGuatemalaGuineaGuinea-BissauGuyanaHeavily indebted poor countries (HIPC)High incomeHondurasHong Kong SAR, ChinaHungaryIBRD onlyIcelandIDA & IBRD totalIDA blendIDA onlyIDA totalIndiaIndonesiaIran, Islamic Rep.IraqIrelandIsraelItalyJamaicaJapanJordanKazakhstanKenyaKiribatiKorea, Dem. People’s Rep.Korea, Rep.KuwaitKyrgyz RepublicLao PDRLate-demographic dividendLatin America & Caribbean Latin America & Caribbean (excluding high income)Latin America & the Caribbean (IDA & IBRD countries)LatviaLeast developed countries: UN classificationLebanonLesothoLiberiaLibyaLiechtensteinLithuaniaLow & middle incomeLow incomeLower middle incomeLuxembourgMacao SAR, ChinaMacedonia, FYRMadagascarMalawiMaldivesMaliMaltaMarshall IslandsMauritaniaMauritiusMexicoMicronesia, Fed. Sts.Middle East & North AfricaMiddle East & North Africa (excluding high income)Middle East & North Africa (IDA & IBRD countries)Middle incomeMoldovaMongoliaMontenegroMoroccoMozambiqueMyanmarNamibiaNauruNepalNetherlandsNew ZealandNicaraguaNigerNigeriaNorth AmericaNorwayOECD membersOmanOther small statesPacific island small statesPakistanPalauPanamaPapua New GuineaParaguayPeruPhilippinesPolandPortugalPost-demographic dividendPre-demographic dividendPuerto RicoQatarRomaniaRussian FederationRwandaSamoaSan MarinoSao Tome and PrincipeSaudi ArabiaSenegalSerbiaSeychellesSierra LeoneSlovak RepublicSloveniaSmall statesSolomon IslandsSomaliaSouth AfricaSouth AsiaSouth Asia (IDA & IBRD)SpainSri LankaSt. Kitts and NevisSt. LuciaSt. Vincent and the GrenadinesSub-Saharan Africa Sub-Saharan Africa (excluding high income)Sub-Saharan Africa (IDA & IBRD countries)SudanSurinameSwazilandSwedenSwitzerlandSyrian Arab RepublicTajikistanTanzaniaThailandTimor-LesteTogoTongaTrinidad and TobagoTunisiaTurkeyTurkmenistanTuvaluUgandaUkraineUnited Arab EmiratesUnited KingdomUnited StatesUpper middle incomeUruguayUzbekistanVanuatuVenezuela, RBVietnamWest Bank and GazaWorldYemen, Rep.ZambiaZimbabwe Timeline:
This timeline shows a graph from 1971 to 2015 of Arab World. No data until 1970. Number of actual observations by date: 45.
Source name:
World Development Indicators
Source organization:
United Nations Educational, Scientific, and Cultural Organization (UNESCO) Institute for Statistics.
Categories, topics:
Education, Gender
Last updated:
apr 23, 2017
Indicators value changes by year
Minimum:
17.766
jan 1, 1972
Maximum:
69.084
jan 1, 2013
At the date of observation
Value
Absolute change
Change from previous value
jan 1, 1971
17.855
+17.855
0.0%
jan 1, 1972
17.766
-0.089
-0.5%
jan 1, 1973
18.527
+0.762
4.29%
jan 1, 1974
19.39
+0.862
4.65%
jan 1, 1975
20.314
+0.925
4.77%
jan 1, 1976
21.432
+1.117
5.5%
jan 1, 1977
23.073
+1.642
7.66%
jan 1, 1978
24.961
+1.888
8.18%
jan 1, 1979
26.643
+1.682
6.74%
jan 1, 1980
28.176
+1.533
5.75%
jan 1, 1981
29.392
+1.216
4.31%
jan 1, 1982
30.542
+1.15
3.91%
jan 1, 1983
32.274
+1.732
5.67%
jan 1, 1984
33.747
+1.473
4.56%
jan 1, 1985
35.273
+1.526
4.52%
jan 1, 1986
37.008
+1.735
4.92%
jan 1, 1987
39.029
+2.021
5.46%
jan 1, 1988
40.465
+1.436
3.68%
jan 1, 1989
41.338
+0.873
2.16%
jan 1, 1990
42.314
+0.976
2.36%
jan 1, 1991
45.425
+3.111
7.35%
jan 1, 1992
45.959
+0.534
1.18%
jan 1, 1993
45.558
-0.401
-0.87%
jan 1, 1994
46.425
+0.867
1.9%
jan 1, 1995
48.353
+1.928
4.15%
jan 1, 1996
48.93
+0.576
1.19%
jan 1, 1997
49.011
+0.081
0.17%
jan 1, 1998
50.573
+1.562
3.19%
jan 1, 1999
52.445
+1.872
3.7%
jan 1, 2000
54.394
+1.949
3.72%
jan 1, 2001
55.904
+1.51
2.78%
jan 1, 2002
57.476
+1.572
2.81%
jan 1, 2003
58.96
+1.483
2.58%
jan 1, 2004
61.065
+2.105
3.57%
jan 1, 2005
62.9
+1.835
3.01%
jan 1, 2006
63.383
+0.483
0.77%
jan 1, 2007
63.554
+0.171
0.27%
jan 1, 2008
62.551
-1.003
-1.58%
jan 1, 2009
63.071
+0.52
0.83%
jan 1, 2010
64.341
+1.27
2.01%
jan 1, 2011
65.475
+1.134
1.76%
jan 1, 2012
68.15
+2.676
4.09%
jan 1, 2013
69.084
+0.933
1.37%
jan 1, 2014
67.673
-1.411
-2.04%
jan 1, 2015
67.969
+0.296
0.44%
Ranking of countries by current statistics by years


Comments: