29
/
en
AIzaSyAYiBZKx7MnpbEhh9jyipgxe19OcubqV5w
April 1, 2024
161950
Italy
ITA
true
2
1
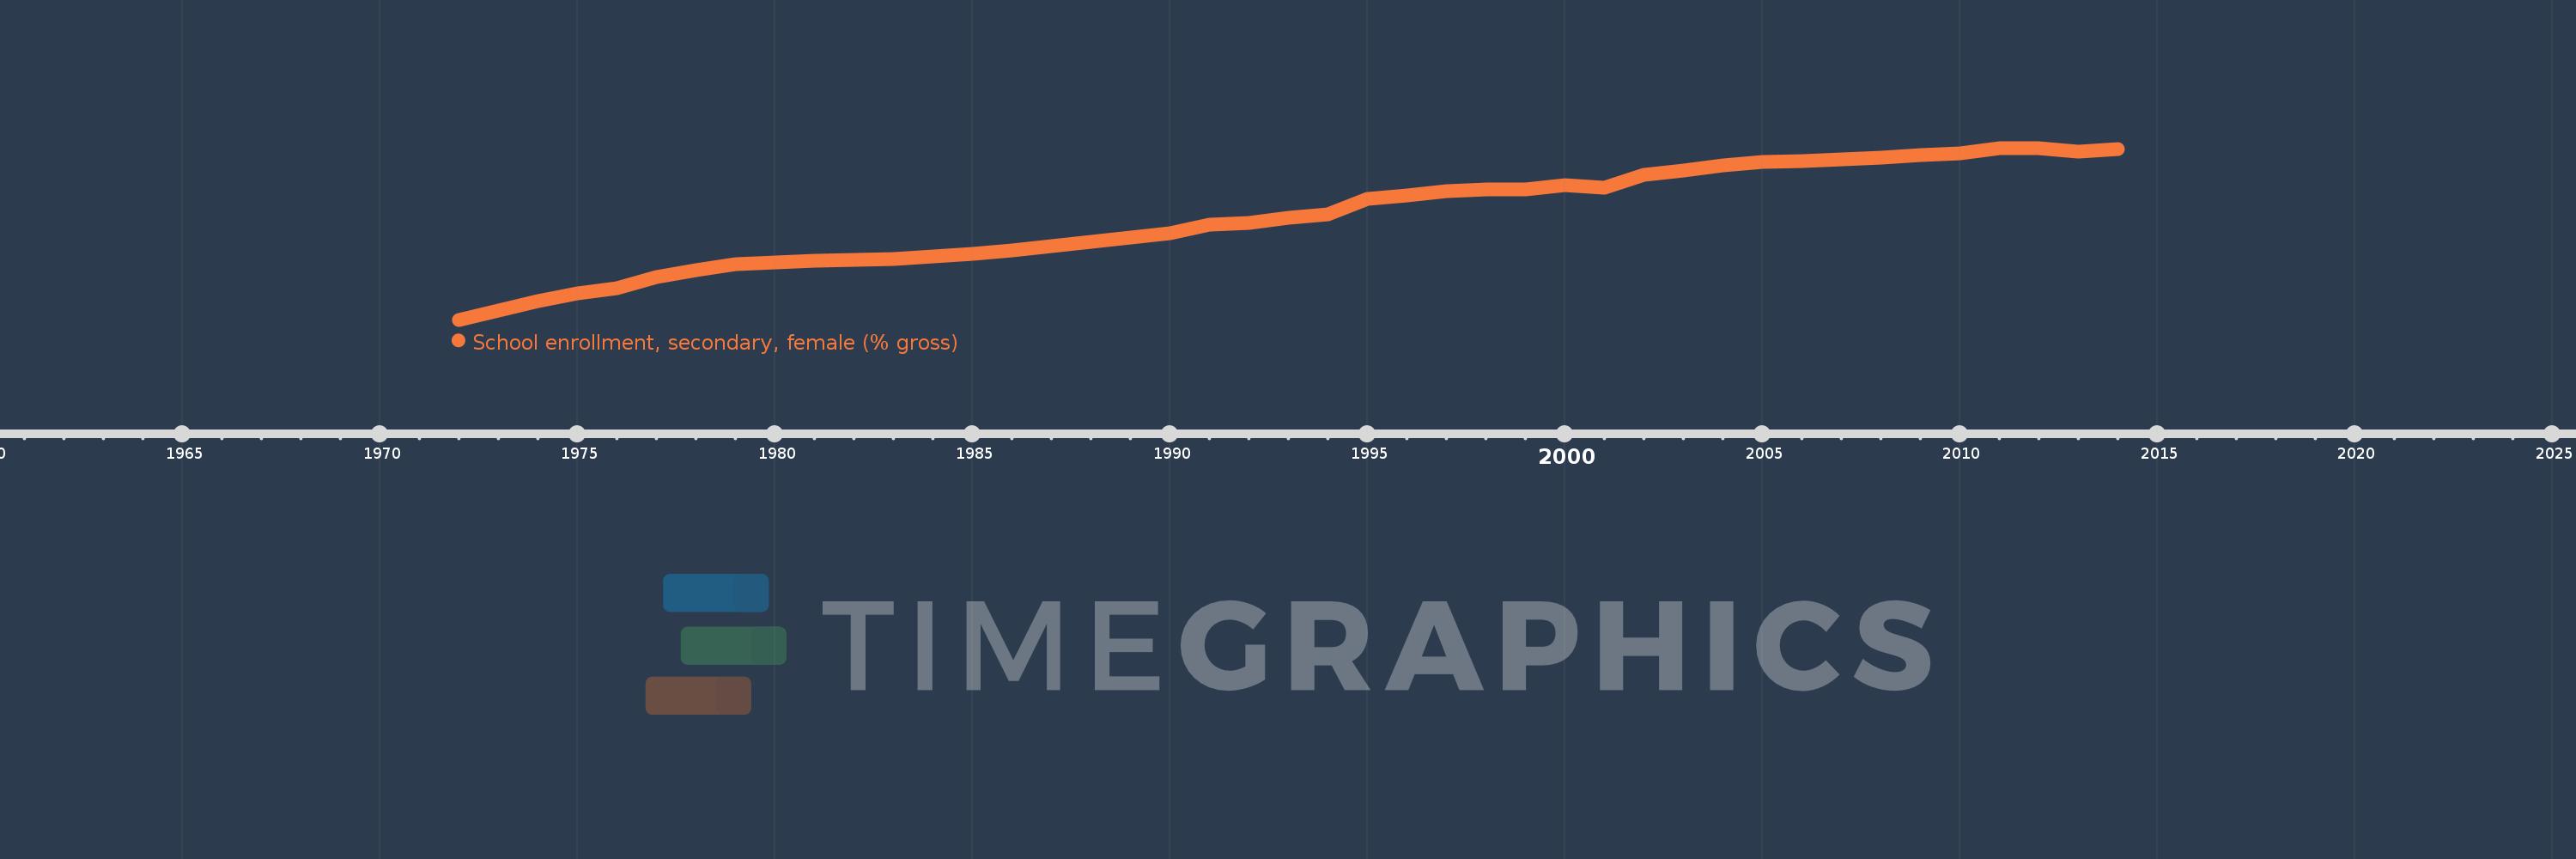
School enrollment, secondary, female (% gross)
2014,2013,2012,2011,2010,2009,2008,2007,2006,2005,2004,2003,2002,2001,2000,1999,1998,1997,1996,1995,1994,1993,1992,1991,1990,1989,1988,1987,1986,1985,1984,1983,1982,1981,1980,1979,1978,1977,1976,1975,1974,1973,1972
This statistics in other country:
AfghanistanAlbaniaAlgeriaAndorraAngolaAntigua and BarbudaArab WorldArgentinaArmeniaArubaAustraliaAustriaAzerbaijanBahamas, TheBahrainBangladeshBarbadosBelarusBelgiumBelizeBeninBermudaBhutanBoliviaBosnia and HerzegovinaBotswanaBrazilBrunei DarussalamBulgariaBurkina FasoBurundiCabo VerdeCambodiaCameroonCanadaCaribbean small statesCentral African RepublicCentral Europe and the BalticsChadChileChinaColombiaComorosCongo, Dem. Rep.Congo, Rep.Costa RicaCote d'IvoireCroatiaCubaCuracaoCyprusCzech RepublicDenmarkDjiboutiDominicaDominican RepublicEarly-demographic dividendEast Asia & PacificEast Asia & Pacific (excluding high income)East Asia & Pacific (IDA & IBRD countries)EcuadorEgypt, Arab Rep.El SalvadorEquatorial GuineaEritreaEstoniaEthiopiaEuro areaEurope & Central AsiaEurope & Central Asia (excluding high income)Europe & Central Asia (IDA & IBRD countries)European UnionFijiFinlandFragile and conflict affected situationsFranceGabonGambia, TheGeorgiaGermanyGhanaGreeceGrenadaGuatemalaGuineaGuinea-BissauGuyanaHeavily indebted poor countries (HIPC)High incomeHondurasHong Kong SAR, ChinaHungaryIBRD onlyIcelandIDA & IBRD totalIDA blendIDA onlyIDA totalIndiaIndonesiaIran, Islamic Rep.IraqIrelandIsraelItalyJamaicaJapanJordanKazakhstanKenyaKiribatiKorea, Dem. People’s Rep.Korea, Rep.KuwaitKyrgyz RepublicLao PDRLate-demographic dividendLatin America & Caribbean Latin America & Caribbean (excluding high income)Latin America & the Caribbean (IDA & IBRD countries)LatviaLeast developed countries: UN classificationLebanonLesothoLiberiaLibyaLiechtensteinLithuaniaLow & middle incomeLow incomeLower middle incomeLuxembourgMacao SAR, ChinaMacedonia, FYRMadagascarMalawiMaldivesMaliMaltaMarshall IslandsMauritaniaMauritiusMexicoMicronesia, Fed. Sts.Middle East & North AfricaMiddle East & North Africa (excluding high income)Middle East & North Africa (IDA & IBRD countries)Middle incomeMoldovaMongoliaMontenegroMoroccoMozambiqueMyanmarNamibiaNauruNepalNetherlandsNew ZealandNicaraguaNigerNigeriaNorth AmericaNorwayOECD membersOmanOther small statesPacific island small statesPakistanPalauPanamaPapua New GuineaParaguayPeruPhilippinesPolandPortugalPost-demographic dividendPre-demographic dividendPuerto RicoQatarRomaniaRussian FederationRwandaSamoaSan MarinoSao Tome and PrincipeSaudi ArabiaSenegalSerbiaSeychellesSierra LeoneSlovak RepublicSloveniaSmall statesSolomon IslandsSomaliaSouth AfricaSouth AsiaSouth Asia (IDA & IBRD)SpainSri LankaSt. Kitts and NevisSt. LuciaSt. Vincent and the GrenadinesSub-Saharan Africa Sub-Saharan Africa (excluding high income)Sub-Saharan Africa (IDA & IBRD countries)SudanSurinameSwazilandSwedenSwitzerlandSyrian Arab RepublicTajikistanTanzaniaThailandTimor-LesteTogoTongaTrinidad and TobagoTunisiaTurkeyTurkmenistanTuvaluUgandaUkraineUnited Arab EmiratesUnited KingdomUnited StatesUpper middle incomeUruguayUzbekistanVanuatuVenezuela, RBVietnamWest Bank and GazaWorldYemen, Rep.ZambiaZimbabwe Timeline:
This timeline shows a graph from 1972 to 2014 of Italy. No data until 1971. Number of actual observations by date: 43.
Source name:
World Development Indicators
Source organization:
United Nations Educational, Scientific, and Cultural Organization (UNESCO) Institute for Statistics.
Categories, topics:
Education, Gender
Last updated:
apr 23, 2017
Indicators value changes by year
Minimum:
54.408
jan 1, 1972
Maximum:
101.675
jan 1, 2012
At the date of observation
Value
Absolute change
Change from previous value
jan 1, 1972
54.408
+54.408
0.0%
jan 1, 1973
56.863
+2.455
4.51%
jan 1, 1974
59.518
+2.655
4.67%
jan 1, 1975
61.745
+2.228
3.74%
jan 1, 1976
63.041
+1.296
2.1%
jan 1, 1977
66.195
+3.154
5.0%
jan 1, 1978
68.146
+1.951
2.95%
jan 1, 1979
69.711
+1.566
2.3%
jan 1, 1980
70.261
+0.55
0.79%
jan 1, 1981
70.602
+0.34
0.48%
jan 1, 1982
70.888
+0.286
0.41%
jan 1, 1983
71.204
+0.316
0.45%
jan 1, 1984
71.916
+0.712
1.0%
jan 1, 1985
72.536
+0.619
0.86%
jan 1, 1986
73.405
+0.87
1.2%
jan 1, 1987
74.589
+1.183
1.61%
jan 1, 1988
75.858
+1.27
1.7%
jan 1, 1989
77.074
+1.216
1.6%
jan 1, 1990
78.283
+1.209
1.57%
jan 1, 1991
80.599
+2.316
2.96%
jan 1, 1992
81.034
+0.435
0.54%
jan 1, 1993
82.357
+1.323
1.63%
jan 1, 1994
83.516
+1.159
1.41%
jan 1, 1995
87.547
+4.031
4.83%
jan 1, 1996
88.675
+1.128
1.29%
jan 1, 1997
89.671
+0.995
1.12%
jan 1, 1998
90.255
+0.584
0.65%
jan 1, 1999
90.196
-0.059
-0.07%
jan 1, 2000
91.38
+1.184
1.31%
jan 1, 2001
90.669
-0.711
-0.78%
jan 1, 2002
94.283
+3.614
3.99%
jan 1, 2003
95.562
+1.278
1.36%
jan 1, 2004
96.889
+1.327
1.39%
jan 1, 2005
97.749
+0.861
0.89%
jan 1, 2006
97.945
+0.196
0.2%
jan 1, 2007
98.601
+0.657
0.67%
jan 1, 2008
99.094
+0.493
0.5%
jan 1, 2009
99.792
+0.698
0.7%
jan 1, 2010
100.2
+0.408
0.41%
jan 1, 2011
101.489
+1.289
1.29%
jan 1, 2012
101.675
+0.186
0.18%
jan 1, 2013
100.659
-1.016
-1.0%
jan 1, 2014
101.381
+0.723
0.72%
Ranking of countries by current statistics by years


Comments: