29
/
en
AIzaSyAYiBZKx7MnpbEhh9jyipgxe19OcubqV5w
April 1, 2024
248029
Spain
ESP
true
2
1
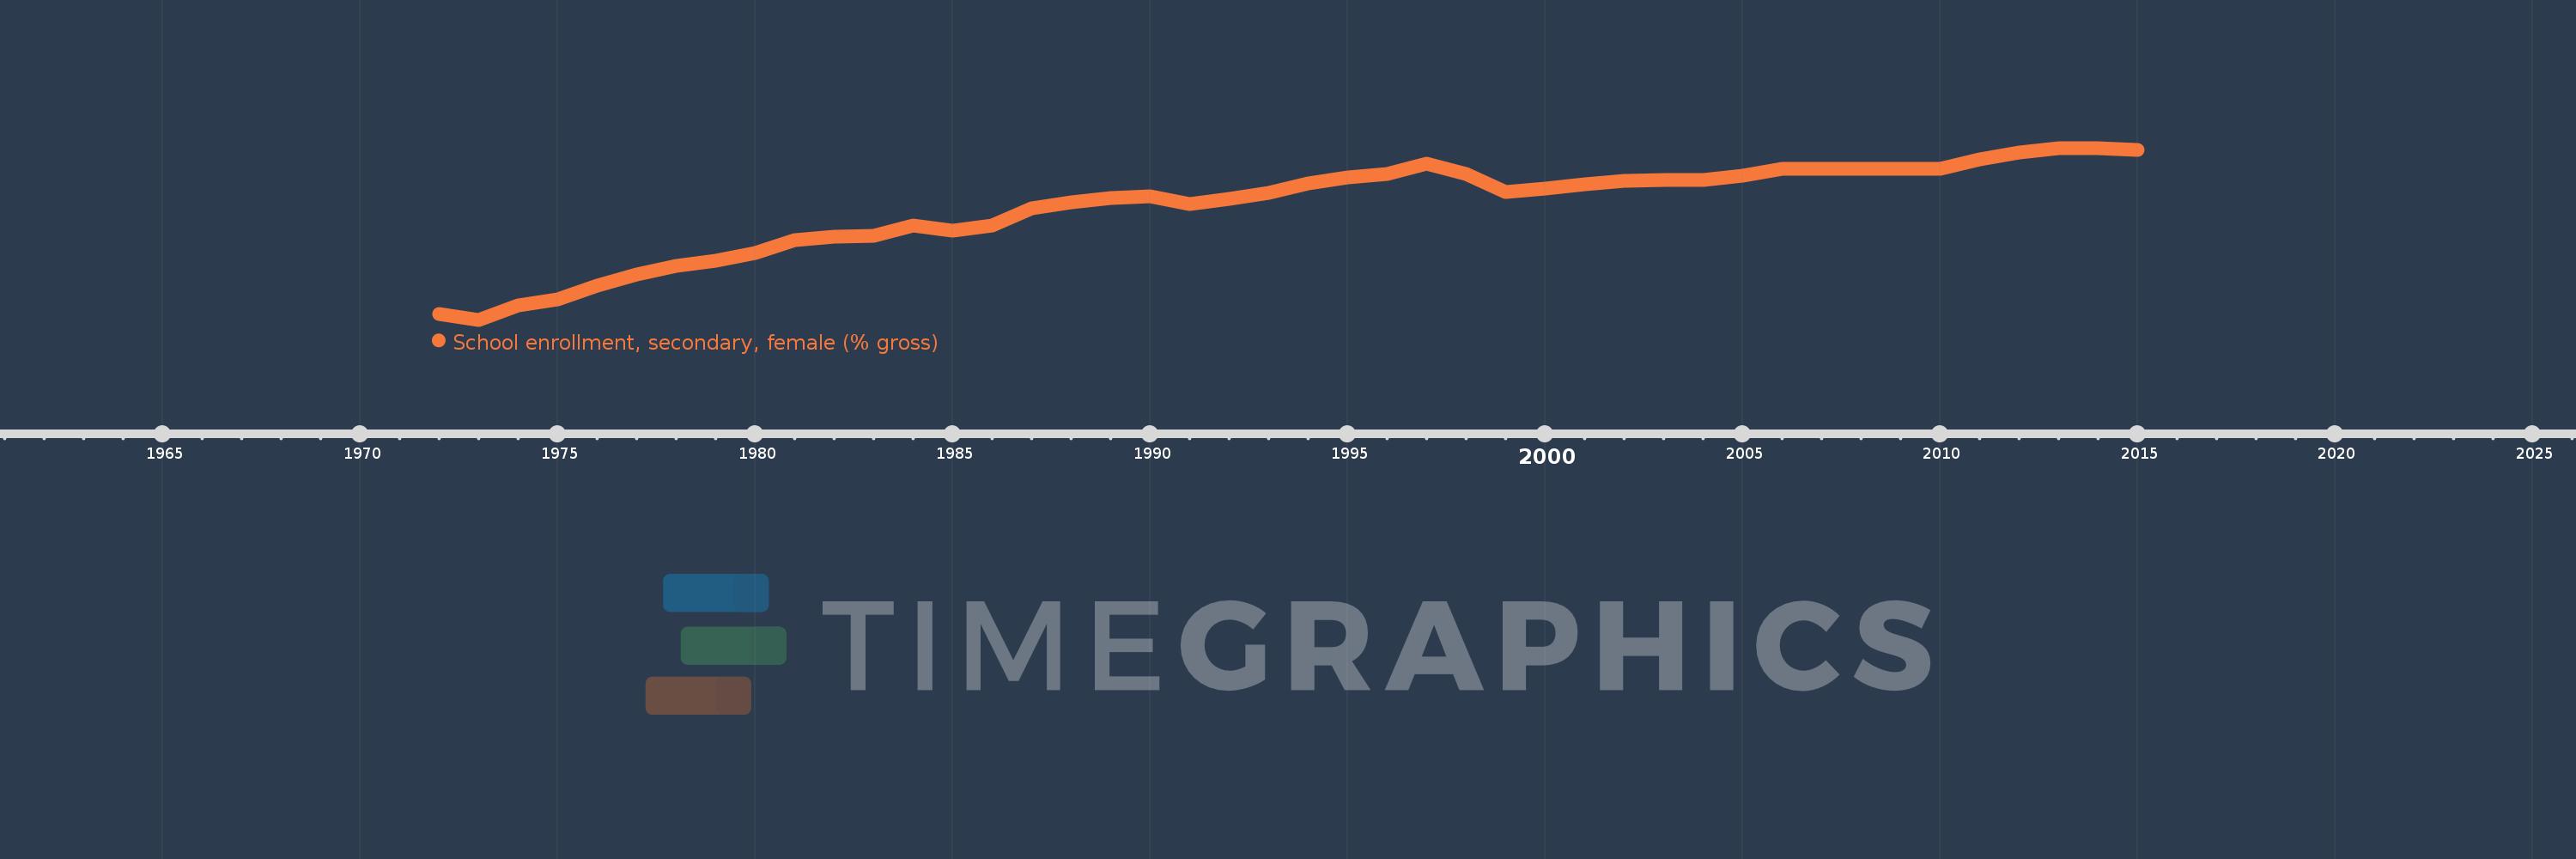
School enrollment, secondary, female (% gross)
2015,2014,2013,2012,2011,2010,2009,2008,2007,2006,2005,2004,2003,2002,2001,2000,1999,1998,1997,1996,1995,1994,1993,1992,1991,1990,1989,1988,1987,1986,1985,1984,1983,1982,1981,1980,1979,1978,1977,1976,1975,1974,1973,1972
This statistics in other country:
AfghanistanAlbaniaAlgeriaAndorraAngolaAntigua and BarbudaArab WorldArgentinaArmeniaArubaAustraliaAustriaAzerbaijanBahamas, TheBahrainBangladeshBarbadosBelarusBelgiumBelizeBeninBermudaBhutanBoliviaBosnia and HerzegovinaBotswanaBrazilBrunei DarussalamBulgariaBurkina FasoBurundiCabo VerdeCambodiaCameroonCanadaCaribbean small statesCentral African RepublicCentral Europe and the BalticsChadChileChinaColombiaComorosCongo, Dem. Rep.Congo, Rep.Costa RicaCote d'IvoireCroatiaCubaCuracaoCyprusCzech RepublicDenmarkDjiboutiDominicaDominican RepublicEarly-demographic dividendEast Asia & PacificEast Asia & Pacific (excluding high income)East Asia & Pacific (IDA & IBRD countries)EcuadorEgypt, Arab Rep.El SalvadorEquatorial GuineaEritreaEstoniaEthiopiaEuro areaEurope & Central AsiaEurope & Central Asia (excluding high income)Europe & Central Asia (IDA & IBRD countries)European UnionFijiFinlandFragile and conflict affected situationsFranceGabonGambia, TheGeorgiaGermanyGhanaGreeceGrenadaGuatemalaGuineaGuinea-BissauGuyanaHeavily indebted poor countries (HIPC)High incomeHondurasHong Kong SAR, ChinaHungaryIBRD onlyIcelandIDA & IBRD totalIDA blendIDA onlyIDA totalIndiaIndonesiaIran, Islamic Rep.IraqIrelandIsraelItalyJamaicaJapanJordanKazakhstanKenyaKiribatiKorea, Dem. People’s Rep.Korea, Rep.KuwaitKyrgyz RepublicLao PDRLate-demographic dividendLatin America & Caribbean Latin America & Caribbean (excluding high income)Latin America & the Caribbean (IDA & IBRD countries)LatviaLeast developed countries: UN classificationLebanonLesothoLiberiaLibyaLiechtensteinLithuaniaLow & middle incomeLow incomeLower middle incomeLuxembourgMacao SAR, ChinaMacedonia, FYRMadagascarMalawiMaldivesMaliMaltaMarshall IslandsMauritaniaMauritiusMexicoMicronesia, Fed. Sts.Middle East & North AfricaMiddle East & North Africa (excluding high income)Middle East & North Africa (IDA & IBRD countries)Middle incomeMoldovaMongoliaMontenegroMoroccoMozambiqueMyanmarNamibiaNauruNepalNetherlandsNew ZealandNicaraguaNigerNigeriaNorth AmericaNorwayOECD membersOmanOther small statesPacific island small statesPakistanPalauPanamaPapua New GuineaParaguayPeruPhilippinesPolandPortugalPost-demographic dividendPre-demographic dividendPuerto RicoQatarRomaniaRussian FederationRwandaSamoaSan MarinoSao Tome and PrincipeSaudi ArabiaSenegalSerbiaSeychellesSierra LeoneSlovak RepublicSloveniaSmall statesSolomon IslandsSomaliaSouth AfricaSouth AsiaSouth Asia (IDA & IBRD)SpainSri LankaSt. Kitts and NevisSt. LuciaSt. Vincent and the GrenadinesSub-Saharan Africa Sub-Saharan Africa (excluding high income)Sub-Saharan Africa (IDA & IBRD countries)SudanSurinameSwazilandSwedenSwitzerlandSyrian Arab RepublicTajikistanTanzaniaThailandTimor-LesteTogoTongaTrinidad and TobagoTunisiaTurkeyTurkmenistanTuvaluUgandaUkraineUnited Arab EmiratesUnited KingdomUnited StatesUpper middle incomeUruguayUzbekistanVanuatuVenezuela, RBVietnamWest Bank and GazaWorldYemen, Rep.ZambiaZimbabwe Timeline:
This timeline shows a graph from 1972 to 2015 of Spain. No data until 1971. Number of actual observations by date: 44.
Source name:
World Development Indicators
Source organization:
United Nations Educational, Scientific, and Cultural Organization (UNESCO) Institute for Statistics.
Categories, topics:
Education, Gender
Last updated:
apr 23, 2017
Indicators value changes by year
Minimum:
47.557
jan 1, 1973
Maximum:
131.511
jan 1, 2013
At the date of observation
Value
Absolute change
Change from previous value
jan 1, 1972
50.286
+50.286
0.0%
jan 1, 1973
47.557
-2.729
-5.43%
jan 1, 1974
54.569
+7.012
14.74%
jan 1, 1975
57.639
+3.07
5.63%
jan 1, 1976
64.238
+6.598
11.45%
jan 1, 1977
69.699
+5.462
8.5%
jan 1, 1978
73.886
+4.187
6.01%
jan 1, 1979
76.316
+2.43
3.29%
jan 1, 1980
80.161
+3.846
5.04%
jan 1, 1981
86.428
+6.267
7.82%
jan 1, 1982
87.956
+1.528
1.77%
jan 1, 1983
88.442
+0.485
0.55%
jan 1, 1984
93.69
+5.248
5.93%
jan 1, 1985
91.229
-2.461
-2.63%
jan 1, 1986
93.605
+2.377
2.61%
jan 1, 1987
102.194
+8.589
9.18%
jan 1, 1988
104.794
+2.6
2.54%
jan 1, 1989
107.057
+2.263
2.16%
jan 1, 1990
107.822
+0.765
0.71%
jan 1, 1991
104.163
-3.659
-3.39%
jan 1, 1992
106.636
+2.473
2.37%
jan 1, 1993
109.508
+2.871
2.69%
jan 1, 1994
114.291
+4.783
4.37%
jan 1, 1995
117.111
+2.821
2.47%
jan 1, 1996
118.931
+1.82
1.55%
jan 1, 1997
123.759
+4.828
4.06%
jan 1, 1998
118.735
-5.024
-4.06%
jan 1, 1999
109.898
-8.837
-7.44%
jan 1, 2000
111.581
+1.683
1.53%
jan 1, 2001
113.953
+2.372
2.13%
jan 1, 2002
115.32
+1.367
1.2%
jan 1, 2003
115.808
+0.488
0.42%
jan 1, 2004
115.664
-0.144
-0.12%
jan 1, 2005
117.786
+2.122
1.83%
jan 1, 2006
121.325
+3.539
3.0%
jan 1, 2007
121.263
-0.062
-0.05%
jan 1, 2008
121.347
+0.084
0.07%
jan 1, 2009
121.173
-0.175
-0.14%
jan 1, 2010
121.12
-0.053
-0.04%
jan 1, 2011
125.798
+4.679
3.86%
jan 1, 2012
129.291
+3.492
2.78%
jan 1, 2013
131.511
+2.22
1.72%
jan 1, 2014
131.357
-0.153
-0.12%
jan 1, 2015
130.41
-0.948
-0.72%
Ranking of countries by current statistics by years


Comments: