29
/
en
AIzaSyAYiBZKx7MnpbEhh9jyipgxe19OcubqV5w
April 1, 2024
25307
Caribbean small states
CSS
false
2
1
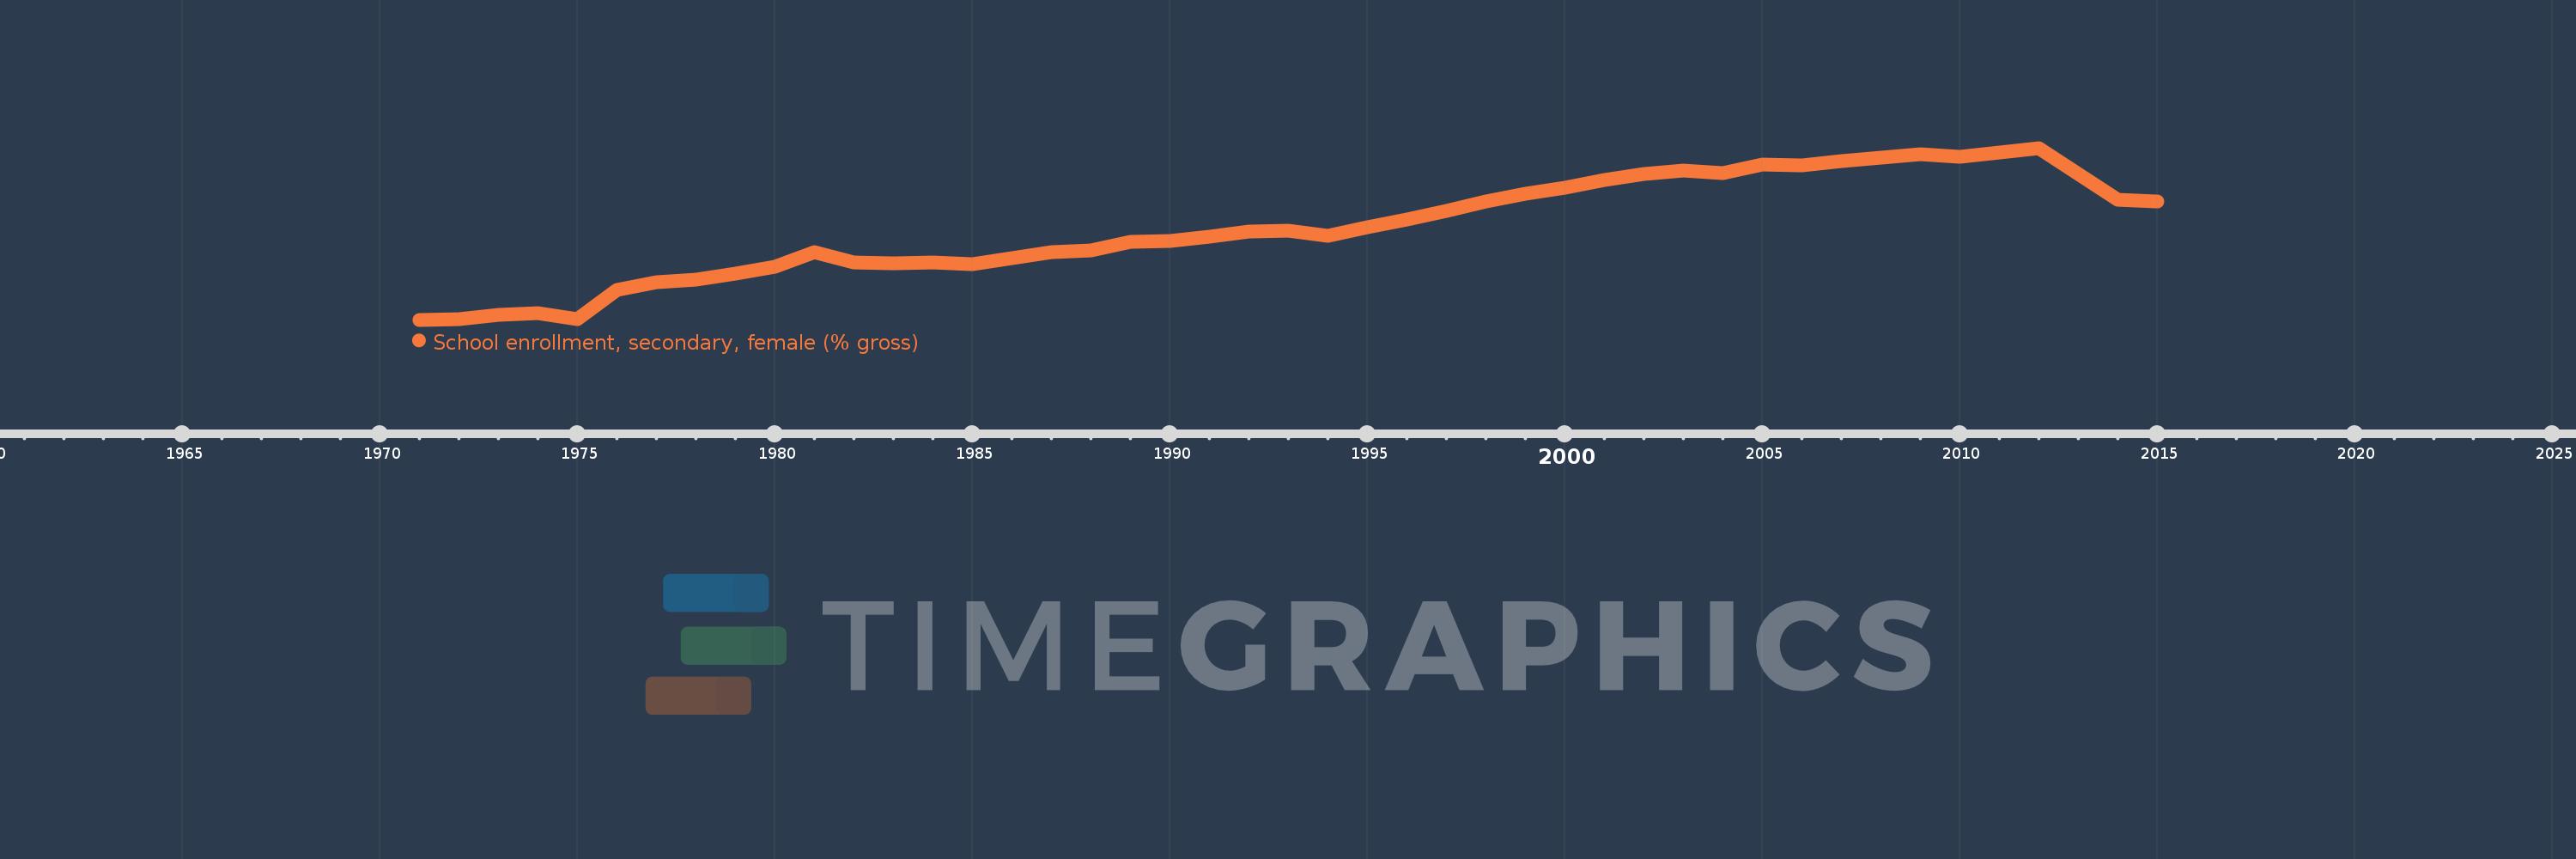
School enrollment, secondary, female (% gross)
2015,2014,2013,2012,2011,2010,2009,2008,2007,2006,2005,2004,2003,2002,2001,2000,1999,1998,1997,1996,1995,1994,1993,1992,1991,1990,1989,1988,1987,1986,1985,1984,1983,1982,1981,1980,1979,1978,1977,1976,1975,1974,1973,1972,1971
This statistics in other country:
AfghanistanAlbaniaAlgeriaAndorraAngolaAntigua and BarbudaArab WorldArgentinaArmeniaArubaAustraliaAustriaAzerbaijanBahamas, TheBahrainBangladeshBarbadosBelarusBelgiumBelizeBeninBermudaBhutanBoliviaBosnia and HerzegovinaBotswanaBrazilBrunei DarussalamBulgariaBurkina FasoBurundiCabo VerdeCambodiaCameroonCanadaCaribbean small statesCentral African RepublicCentral Europe and the BalticsChadChileChinaColombiaComorosCongo, Dem. Rep.Congo, Rep.Costa RicaCote d'IvoireCroatiaCubaCuracaoCyprusCzech RepublicDenmarkDjiboutiDominicaDominican RepublicEarly-demographic dividendEast Asia & PacificEast Asia & Pacific (excluding high income)East Asia & Pacific (IDA & IBRD countries)EcuadorEgypt, Arab Rep.El SalvadorEquatorial GuineaEritreaEstoniaEthiopiaEuro areaEurope & Central AsiaEurope & Central Asia (excluding high income)Europe & Central Asia (IDA & IBRD countries)European UnionFijiFinlandFragile and conflict affected situationsFranceGabonGambia, TheGeorgiaGermanyGhanaGreeceGrenadaGuatemalaGuineaGuinea-BissauGuyanaHeavily indebted poor countries (HIPC)High incomeHondurasHong Kong SAR, ChinaHungaryIBRD onlyIcelandIDA & IBRD totalIDA blendIDA onlyIDA totalIndiaIndonesiaIran, Islamic Rep.IraqIrelandIsraelItalyJamaicaJapanJordanKazakhstanKenyaKiribatiKorea, Dem. People’s Rep.Korea, Rep.KuwaitKyrgyz RepublicLao PDRLate-demographic dividendLatin America & Caribbean Latin America & Caribbean (excluding high income)Latin America & the Caribbean (IDA & IBRD countries)LatviaLeast developed countries: UN classificationLebanonLesothoLiberiaLibyaLiechtensteinLithuaniaLow & middle incomeLow incomeLower middle incomeLuxembourgMacao SAR, ChinaMacedonia, FYRMadagascarMalawiMaldivesMaliMaltaMarshall IslandsMauritaniaMauritiusMexicoMicronesia, Fed. Sts.Middle East & North AfricaMiddle East & North Africa (excluding high income)Middle East & North Africa (IDA & IBRD countries)Middle incomeMoldovaMongoliaMontenegroMoroccoMozambiqueMyanmarNamibiaNauruNepalNetherlandsNew ZealandNicaraguaNigerNigeriaNorth AmericaNorwayOECD membersOmanOther small statesPacific island small statesPakistanPalauPanamaPapua New GuineaParaguayPeruPhilippinesPolandPortugalPost-demographic dividendPre-demographic dividendPuerto RicoQatarRomaniaRussian FederationRwandaSamoaSan MarinoSao Tome and PrincipeSaudi ArabiaSenegalSerbiaSeychellesSierra LeoneSlovak RepublicSloveniaSmall statesSolomon IslandsSomaliaSouth AfricaSouth AsiaSouth Asia (IDA & IBRD)SpainSri LankaSt. Kitts and NevisSt. LuciaSt. Vincent and the GrenadinesSub-Saharan Africa Sub-Saharan Africa (excluding high income)Sub-Saharan Africa (IDA & IBRD countries)SudanSurinameSwazilandSwedenSwitzerlandSyrian Arab RepublicTajikistanTanzaniaThailandTimor-LesteTogoTongaTrinidad and TobagoTunisiaTurkeyTurkmenistanTuvaluUgandaUkraineUnited Arab EmiratesUnited KingdomUnited StatesUpper middle incomeUruguayUzbekistanVanuatuVenezuela, RBVietnamWest Bank and GazaWorldYemen, Rep.ZambiaZimbabwe Timeline:
This timeline shows a graph from 1971 to 2015 of Caribbean small states. No data until 1970. Number of actual observations by date: 45.
Source name:
World Development Indicators
Source organization:
United Nations Educational, Scientific, and Cultural Organization (UNESCO) Institute for Statistics.
Categories, topics:
Education, Gender
Last updated:
apr 23, 2017
Indicators value changes by year
Minimum:
55.001
jan 1, 1971
Maximum:
94.379
jan 1, 2012
At the date of observation
Value
Absolute change
Change from previous value
jan 1, 1971
55.001
+55.001
0.0%
jan 1, 1972
55.066
+0.065
0.12%
jan 1, 1973
56.091
+1.025
1.86%
jan 1, 1974
56.455
+0.365
0.65%
jan 1, 1975
55.096
-1.359
-2.41%
jan 1, 1976
61.77
+6.673
12.11%
jan 1, 1977
63.674
+1.904
3.08%
jan 1, 1978
64.16
+0.487
0.76%
jan 1, 1979
65.627
+1.467
2.29%
jan 1, 1980
67.107
+1.479
2.25%
jan 1, 1981
70.438
+3.332
4.97%
jan 1, 1982
68.225
-2.214
-3.14%
jan 1, 1983
67.973
-0.252
-0.37%
jan 1, 1984
68.077
+0.104
0.15%
jan 1, 1985
67.772
-0.305
-0.45%
jan 1, 1986
69.19
+1.418
2.09%
jan 1, 1987
70.517
+1.327
1.92%
jan 1, 1988
70.905
+0.388
0.55%
jan 1, 1989
72.955
+2.05
2.89%
jan 1, 1990
73.051
+0.096
0.13%
jan 1, 1991
73.995
+0.944
1.29%
jan 1, 1992
75.265
+1.269
1.72%
jan 1, 1993
75.372
+0.107
0.14%
jan 1, 1994
74.267
-1.105
-1.47%
jan 1, 1995
76.118
+1.851
2.49%
jan 1, 1996
77.97
+1.852
2.43%
jan 1, 1997
80.04
+2.07
2.66%
jan 1, 1998
82.19
+2.149
2.69%
jan 1, 1999
83.797
+1.608
1.96%
jan 1, 2000
85.326
+1.529
1.82%
jan 1, 2001
86.987
+1.661
1.95%
jan 1, 2002
88.325
+1.338
1.54%
jan 1, 2003
89.155
+0.829
0.94%
jan 1, 2004
88.621
-0.534
-0.6%
jan 1, 2005
90.51
+1.89
2.13%
jan 1, 2006
90.475
-0.035
-0.04%
jan 1, 2007
91.403
+0.927
1.03%
jan 1, 2008
92.073
+0.67
0.73%
jan 1, 2009
92.926
+0.853
0.93%
jan 1, 2010
92.343
-0.583
-0.63%
jan 1, 2011
93.291
+0.948
1.03%
jan 1, 2012
94.379
+1.088
1.17%
jan 1, 2013
88.397
-5.982
-6.34%
jan 1, 2014
82.433
-5.964
-6.75%
jan 1, 2015
82.186
-0.246
-0.3%
Ranking of countries by current statistics by years


Comments: