29
/
en
AIzaSyAYiBZKx7MnpbEhh9jyipgxe19OcubqV5w
April 1, 2024
208420
Netherlands
NLD
true
2
1
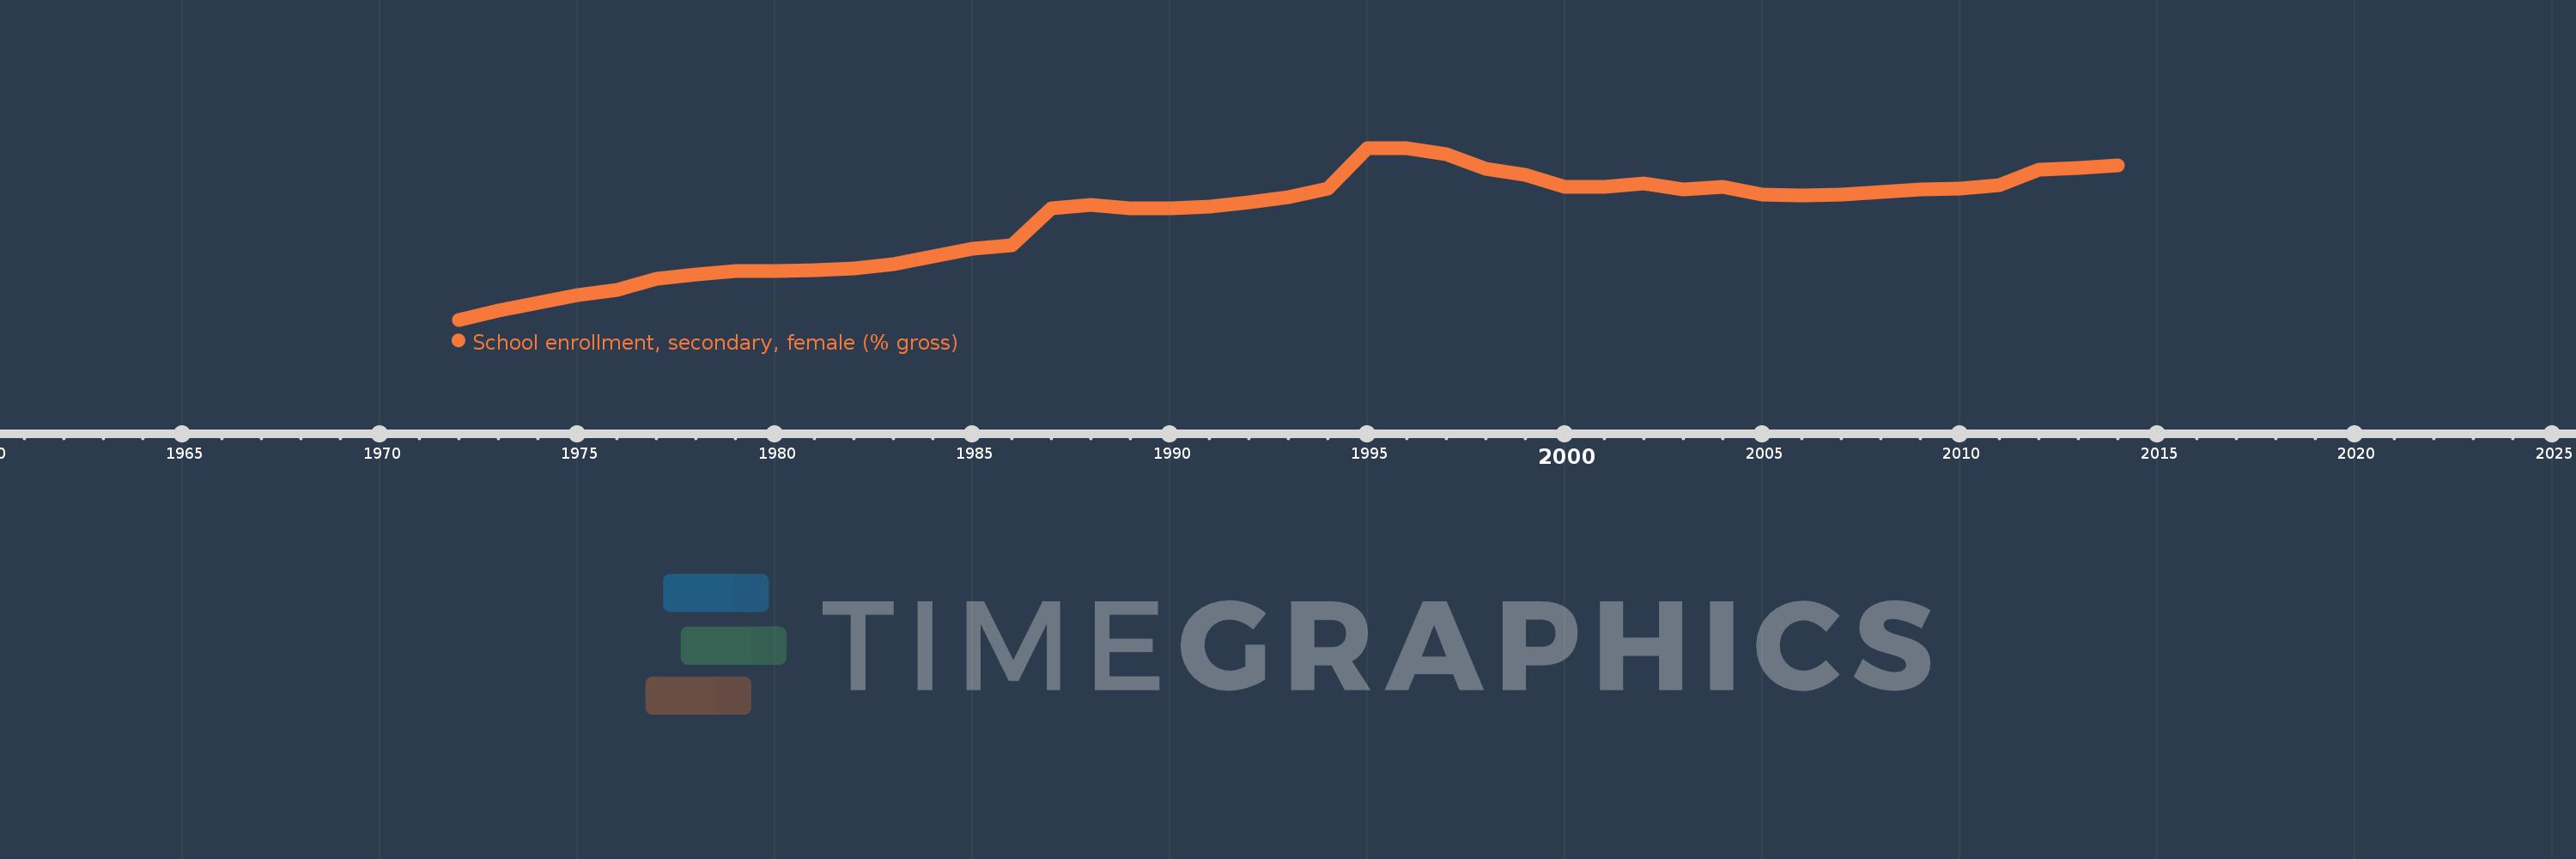
School enrollment, secondary, female (% gross)
2014,2013,2012,2011,2010,2009,2008,2007,2006,2005,2004,2003,2002,2001,2000,1999,1998,1997,1996,1995,1994,1993,1992,1991,1990,1989,1988,1987,1986,1985,1984,1983,1982,1981,1980,1979,1978,1977,1976,1975,1974,1973,1972
This statistics in other country:
AfghanistanAlbaniaAlgeriaAndorraAngolaAntigua and BarbudaArab WorldArgentinaArmeniaArubaAustraliaAustriaAzerbaijanBahamas, TheBahrainBangladeshBarbadosBelarusBelgiumBelizeBeninBermudaBhutanBoliviaBosnia and HerzegovinaBotswanaBrazilBrunei DarussalamBulgariaBurkina FasoBurundiCabo VerdeCambodiaCameroonCanadaCaribbean small statesCentral African RepublicCentral Europe and the BalticsChadChileChinaColombiaComorosCongo, Dem. Rep.Congo, Rep.Costa RicaCote d'IvoireCroatiaCubaCuracaoCyprusCzech RepublicDenmarkDjiboutiDominicaDominican RepublicEarly-demographic dividendEast Asia & PacificEast Asia & Pacific (excluding high income)East Asia & Pacific (IDA & IBRD countries)EcuadorEgypt, Arab Rep.El SalvadorEquatorial GuineaEritreaEstoniaEthiopiaEuro areaEurope & Central AsiaEurope & Central Asia (excluding high income)Europe & Central Asia (IDA & IBRD countries)European UnionFijiFinlandFragile and conflict affected situationsFranceGabonGambia, TheGeorgiaGermanyGhanaGreeceGrenadaGuatemalaGuineaGuinea-BissauGuyanaHeavily indebted poor countries (HIPC)High incomeHondurasHong Kong SAR, ChinaHungaryIBRD onlyIcelandIDA & IBRD totalIDA blendIDA onlyIDA totalIndiaIndonesiaIran, Islamic Rep.IraqIrelandIsraelItalyJamaicaJapanJordanKazakhstanKenyaKiribatiKorea, Dem. People’s Rep.Korea, Rep.KuwaitKyrgyz RepublicLao PDRLate-demographic dividendLatin America & Caribbean Latin America & Caribbean (excluding high income)Latin America & the Caribbean (IDA & IBRD countries)LatviaLeast developed countries: UN classificationLebanonLesothoLiberiaLibyaLiechtensteinLithuaniaLow & middle incomeLow incomeLower middle incomeLuxembourgMacao SAR, ChinaMacedonia, FYRMadagascarMalawiMaldivesMaliMaltaMarshall IslandsMauritaniaMauritiusMexicoMicronesia, Fed. Sts.Middle East & North AfricaMiddle East & North Africa (excluding high income)Middle East & North Africa (IDA & IBRD countries)Middle incomeMoldovaMongoliaMontenegroMoroccoMozambiqueMyanmarNamibiaNauruNepalNetherlandsNew ZealandNicaraguaNigerNigeriaNorth AmericaNorwayOECD membersOmanOther small statesPacific island small statesPakistanPalauPanamaPapua New GuineaParaguayPeruPhilippinesPolandPortugalPost-demographic dividendPre-demographic dividendPuerto RicoQatarRomaniaRussian FederationRwandaSamoaSan MarinoSao Tome and PrincipeSaudi ArabiaSenegalSerbiaSeychellesSierra LeoneSlovak RepublicSloveniaSmall statesSolomon IslandsSomaliaSouth AfricaSouth AsiaSouth Asia (IDA & IBRD)SpainSri LankaSt. Kitts and NevisSt. LuciaSt. Vincent and the GrenadinesSub-Saharan Africa Sub-Saharan Africa (excluding high income)Sub-Saharan Africa (IDA & IBRD countries)SudanSurinameSwazilandSwedenSwitzerlandSyrian Arab RepublicTajikistanTanzaniaThailandTimor-LesteTogoTongaTrinidad and TobagoTunisiaTurkeyTurkmenistanTuvaluUgandaUkraineUnited Arab EmiratesUnited KingdomUnited StatesUpper middle incomeUruguayUzbekistanVanuatuVenezuela, RBVietnamWest Bank and GazaWorldYemen, Rep.ZambiaZimbabwe Timeline:
This timeline shows a graph from 1972 to 2014 of Netherlands. No data until 1971. Number of actual observations by date: 43.
Source name:
World Development Indicators
Source organization:
United Nations Educational, Scientific, and Cultural Organization (UNESCO) Institute for Statistics.
Categories, topics:
Education, Gender
Last updated:
apr 23, 2017
Indicators value changes by year
Minimum:
69.248
jan 1, 1972
Maximum:
136.773
jan 1, 1996
At the date of observation
Value
Absolute change
Change from previous value
jan 1, 1972
69.248
+69.248
0.0%
jan 1, 1973
72.994
+3.746
5.41%
jan 1, 1974
75.804
+2.81
3.85%
jan 1, 1975
78.873
+3.069
4.05%
jan 1, 1976
80.845
+1.972
2.5%
jan 1, 1977
85.316
+4.471
5.53%
jan 1, 1978
87.123
+1.806
2.12%
jan 1, 1979
88.369
+1.246
1.43%
jan 1, 1980
88.296
-0.073
-0.08%
jan 1, 1981
88.85
+0.554
0.63%
jan 1, 1982
89.303
+0.453
0.51%
jan 1, 1983
91.118
+1.815
2.03%
jan 1, 1984
93.969
+2.851
3.13%
jan 1, 1985
97.27
+3.3
3.51%
jan 1, 1986
98.659
+1.39
1.43%
jan 1, 1987
112.916
+14.257
14.45%
jan 1, 1988
114.409
+1.493
1.32%
jan 1, 1989
113.057
-1.352
-1.18%
jan 1, 1990
113.178
+0.121
0.11%
jan 1, 1991
113.851
+0.672
0.59%
jan 1, 1992
115.246
+1.396
1.23%
jan 1, 1993
117.299
+2.053
1.78%
jan 1, 1994
120.866
+3.567
3.04%
jan 1, 1995
136.577
+15.711
13.0%
jan 1, 1996
136.773
+0.196
0.14%
jan 1, 1997
134.286
-2.487
-1.82%
jan 1, 1998
128.665
-5.62
-4.19%
jan 1, 1999
126.155
-2.511
-1.95%
jan 1, 2000
121.481
-4.673
-3.7%
jan 1, 2001
121.584
+0.102
0.08%
jan 1, 2002
122.696
+1.113
0.92%
jan 1, 2003
120.616
-2.08
-1.7%
jan 1, 2004
121.311
+0.695
0.58%
jan 1, 2005
118.319
-2.993
-2.47%
jan 1, 2006
118.15
-0.168
-0.14%
jan 1, 2007
118.4
+0.249
0.21%
jan 1, 2008
119.333
+0.933
0.79%
jan 1, 2009
120.445
+1.112
0.93%
jan 1, 2010
120.678
+0.233
0.19%
jan 1, 2011
122.185
+1.507
1.25%
jan 1, 2012
128.144
+5.959
4.88%
jan 1, 2013
128.858
+0.714
0.56%
jan 1, 2014
129.757
+0.9
0.7%
Ranking of countries by current statistics by years


Comments: