29
/
en
AIzaSyAYiBZKx7MnpbEhh9jyipgxe19OcubqV5w
April 1, 2024
33042
Europe & Central Asia (IDA & IBRD countries)
TEC
false
2
1
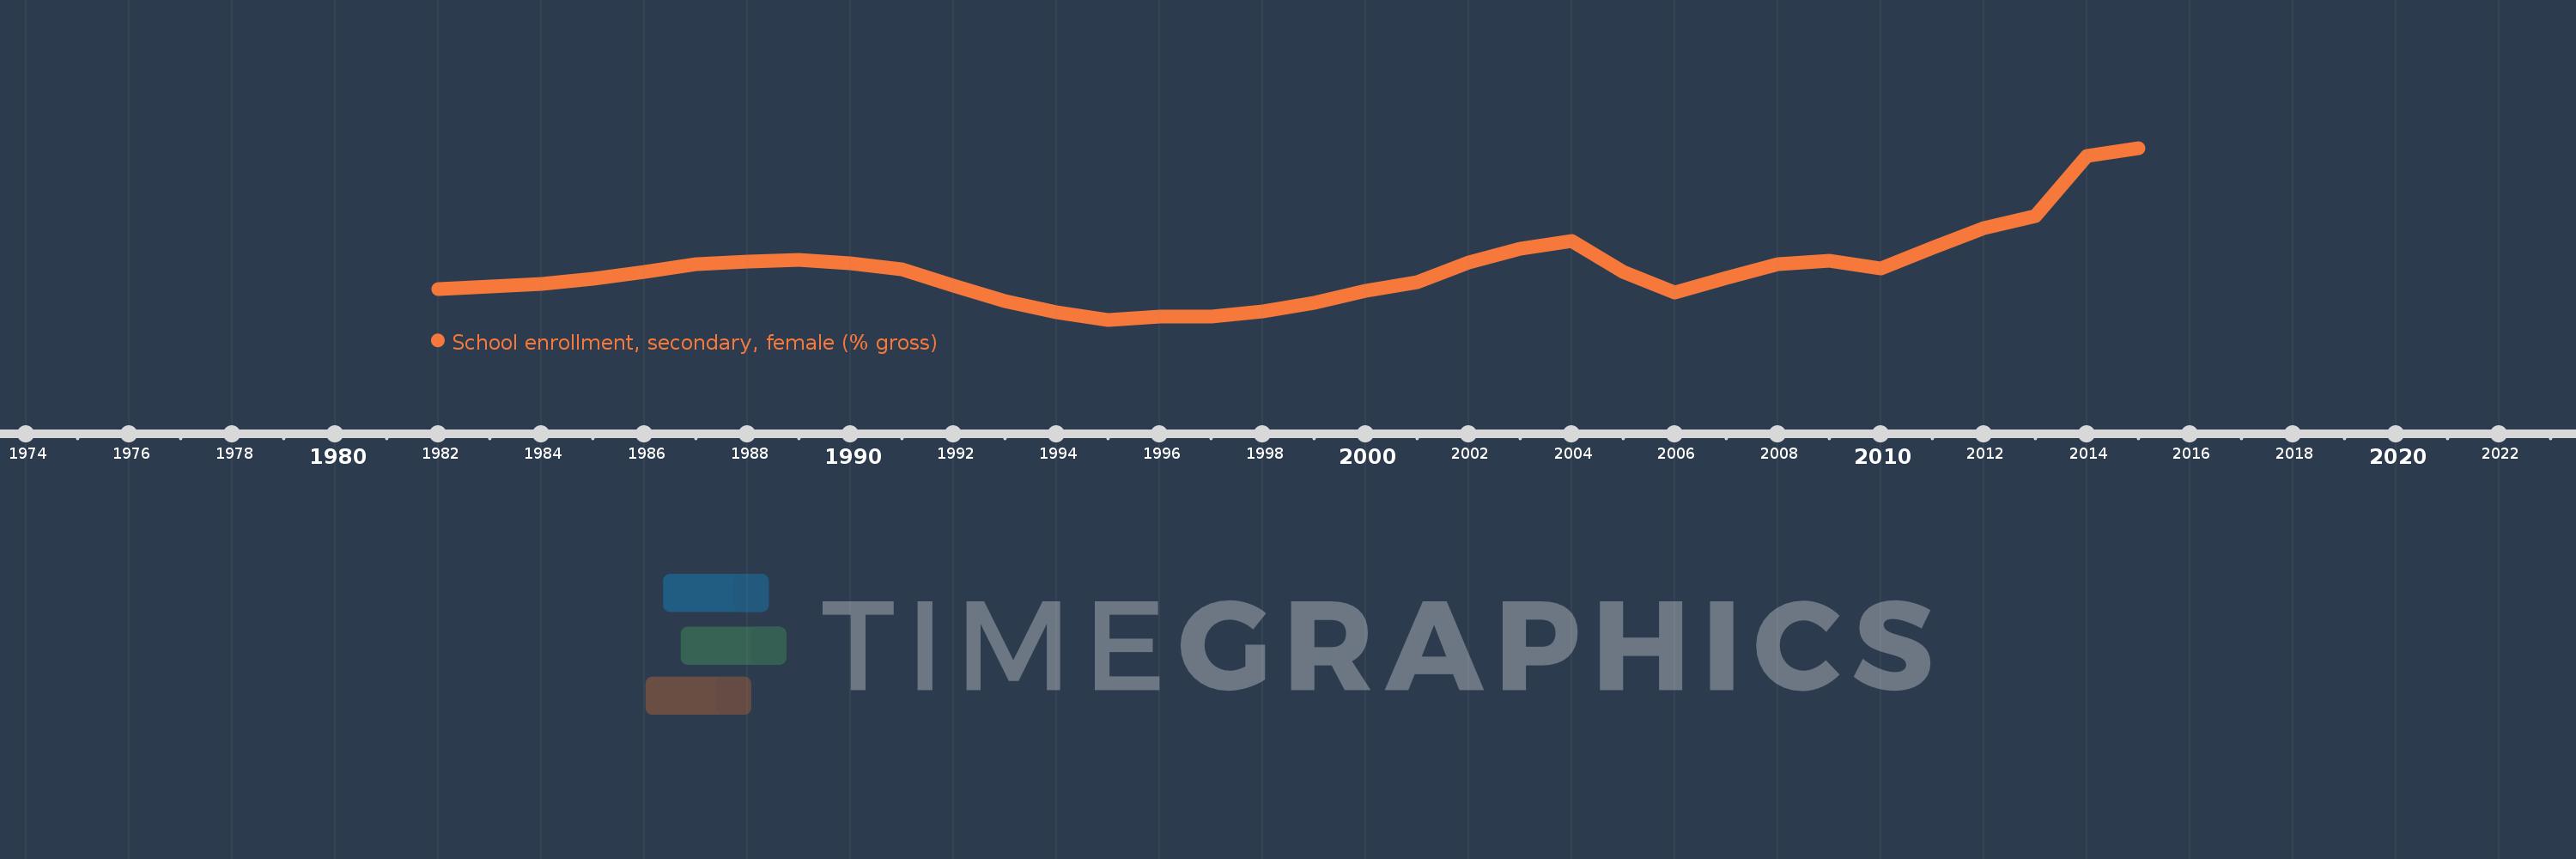
School enrollment, secondary, female (% gross)
2015,2014,2013,2012,2011,2010,2009,2008,2007,2006,2005,2004,2003,2002,2001,2000,1999,1998,1997,1996,1995,1994,1993,1992,1991,1990,1989,1988,1987,1986,1985,1984,1983,1982
This statistics in other country:
AfghanistanAlbaniaAlgeriaAndorraAngolaAntigua and BarbudaArab WorldArgentinaArmeniaArubaAustraliaAustriaAzerbaijanBahamas, TheBahrainBangladeshBarbadosBelarusBelgiumBelizeBeninBermudaBhutanBoliviaBosnia and HerzegovinaBotswanaBrazilBrunei DarussalamBulgariaBurkina FasoBurundiCabo VerdeCambodiaCameroonCanadaCaribbean small statesCentral African RepublicCentral Europe and the BalticsChadChileChinaColombiaComorosCongo, Dem. Rep.Congo, Rep.Costa RicaCote d'IvoireCroatiaCubaCuracaoCyprusCzech RepublicDenmarkDjiboutiDominicaDominican RepublicEarly-demographic dividendEast Asia & PacificEast Asia & Pacific (excluding high income)East Asia & Pacific (IDA & IBRD countries)EcuadorEgypt, Arab Rep.El SalvadorEquatorial GuineaEritreaEstoniaEthiopiaEuro areaEurope & Central AsiaEurope & Central Asia (excluding high income)Europe & Central Asia (IDA & IBRD countries)European UnionFijiFinlandFragile and conflict affected situationsFranceGabonGambia, TheGeorgiaGermanyGhanaGreeceGrenadaGuatemalaGuineaGuinea-BissauGuyanaHeavily indebted poor countries (HIPC)High incomeHondurasHong Kong SAR, ChinaHungaryIBRD onlyIcelandIDA & IBRD totalIDA blendIDA onlyIDA totalIndiaIndonesiaIran, Islamic Rep.IraqIrelandIsraelItalyJamaicaJapanJordanKazakhstanKenyaKiribatiKorea, Dem. People’s Rep.Korea, Rep.KuwaitKyrgyz RepublicLao PDRLate-demographic dividendLatin America & Caribbean Latin America & Caribbean (excluding high income)Latin America & the Caribbean (IDA & IBRD countries)LatviaLeast developed countries: UN classificationLebanonLesothoLiberiaLibyaLiechtensteinLithuaniaLow & middle incomeLow incomeLower middle incomeLuxembourgMacao SAR, ChinaMacedonia, FYRMadagascarMalawiMaldivesMaliMaltaMarshall IslandsMauritaniaMauritiusMexicoMicronesia, Fed. Sts.Middle East & North AfricaMiddle East & North Africa (excluding high income)Middle East & North Africa (IDA & IBRD countries)Middle incomeMoldovaMongoliaMontenegroMoroccoMozambiqueMyanmarNamibiaNauruNepalNetherlandsNew ZealandNicaraguaNigerNigeriaNorth AmericaNorwayOECD membersOmanOther small statesPacific island small statesPakistanPalauPanamaPapua New GuineaParaguayPeruPhilippinesPolandPortugalPost-demographic dividendPre-demographic dividendPuerto RicoQatarRomaniaRussian FederationRwandaSamoaSan MarinoSao Tome and PrincipeSaudi ArabiaSenegalSerbiaSeychellesSierra LeoneSlovak RepublicSloveniaSmall statesSolomon IslandsSomaliaSouth AfricaSouth AsiaSouth Asia (IDA & IBRD)SpainSri LankaSt. Kitts and NevisSt. LuciaSt. Vincent and the GrenadinesSub-Saharan Africa Sub-Saharan Africa (excluding high income)Sub-Saharan Africa (IDA & IBRD countries)SudanSurinameSwazilandSwedenSwitzerlandSyrian Arab RepublicTajikistanTanzaniaThailandTimor-LesteTogoTongaTrinidad and TobagoTunisiaTurkeyTurkmenistanTuvaluUgandaUkraineUnited Arab EmiratesUnited KingdomUnited StatesUpper middle incomeUruguayUzbekistanVanuatuVenezuela, RBVietnamWest Bank and GazaWorldYemen, Rep.ZambiaZimbabwe Timeline:
This timeline shows a graph from 1982 to 2015 of Europe & Central Asia (IDA & IBRD countries). No data until 1981. Number of actual observations by date: 34.
Source name:
World Development Indicators
Source organization:
United Nations Educational, Scientific, and Cultural Organization (UNESCO) Institute for Statistics.
Categories, topics:
Education, Gender
Last updated:
apr 23, 2017
Indicators value changes by year
Minimum:
83.422
jan 1, 1995
Maximum:
97.957
jan 1, 2015
At the date of observation
Value
Absolute change
Change from previous value
jan 1, 1982
86.032
+86.032
0.0%
jan 1, 1983
86.232
+0.201
0.23%
jan 1, 1984
86.463
+0.23
0.27%
jan 1, 1985
86.853
+0.391
0.45%
jan 1, 1986
87.44
+0.586
0.67%
jan 1, 1987
88.097
+0.657
0.75%
jan 1, 1988
88.308
+0.211
0.24%
jan 1, 1989
88.485
+0.176
0.2%
jan 1, 1990
88.2
-0.285
-0.32%
jan 1, 1991
87.7
-0.5
-0.57%
jan 1, 1992
86.299
-1.401
-1.6%
jan 1, 1993
85.012
-1.287
-1.49%
jan 1, 1994
84.08
-0.933
-1.1%
jan 1, 1995
83.422
-0.658
-0.78%
jan 1, 1996
83.723
+0.302
0.36%
jan 1, 1997
83.707
-0.017
-0.02%
jan 1, 1998
84.133
+0.427
0.51%
jan 1, 1999
84.858
+0.724
0.86%
jan 1, 2000
85.902
+1.044
1.23%
jan 1, 2001
86.615
+0.714
0.83%
jan 1, 2002
88.251
+1.635
1.89%
jan 1, 2003
89.403
+1.152
1.31%
jan 1, 2004
90.118
+0.715
0.8%
jan 1, 2005
87.481
-2.637
-2.93%
jan 1, 2006
85.744
-1.737
-1.99%
jan 1, 2007
86.967
+1.223
1.43%
jan 1, 2008
88.117
+1.151
1.32%
jan 1, 2009
88.407
+0.289
0.33%
jan 1, 2010
87.751
-0.656
-0.74%
jan 1, 2011
89.518
+1.766
2.01%
jan 1, 2012
91.199
+1.681
1.88%
jan 1, 2013
92.191
+0.992
1.09%
jan 1, 2014
97.315
+5.124
5.56%
jan 1, 2015
97.957
+0.642
0.66%
Ranking of countries by current statistics by years


Comments: