29
/
en
AIzaSyAYiBZKx7MnpbEhh9jyipgxe19OcubqV5w
April 1, 2024
32174
Europe & Central Asia (excluding high income)
ECA
false
2
1
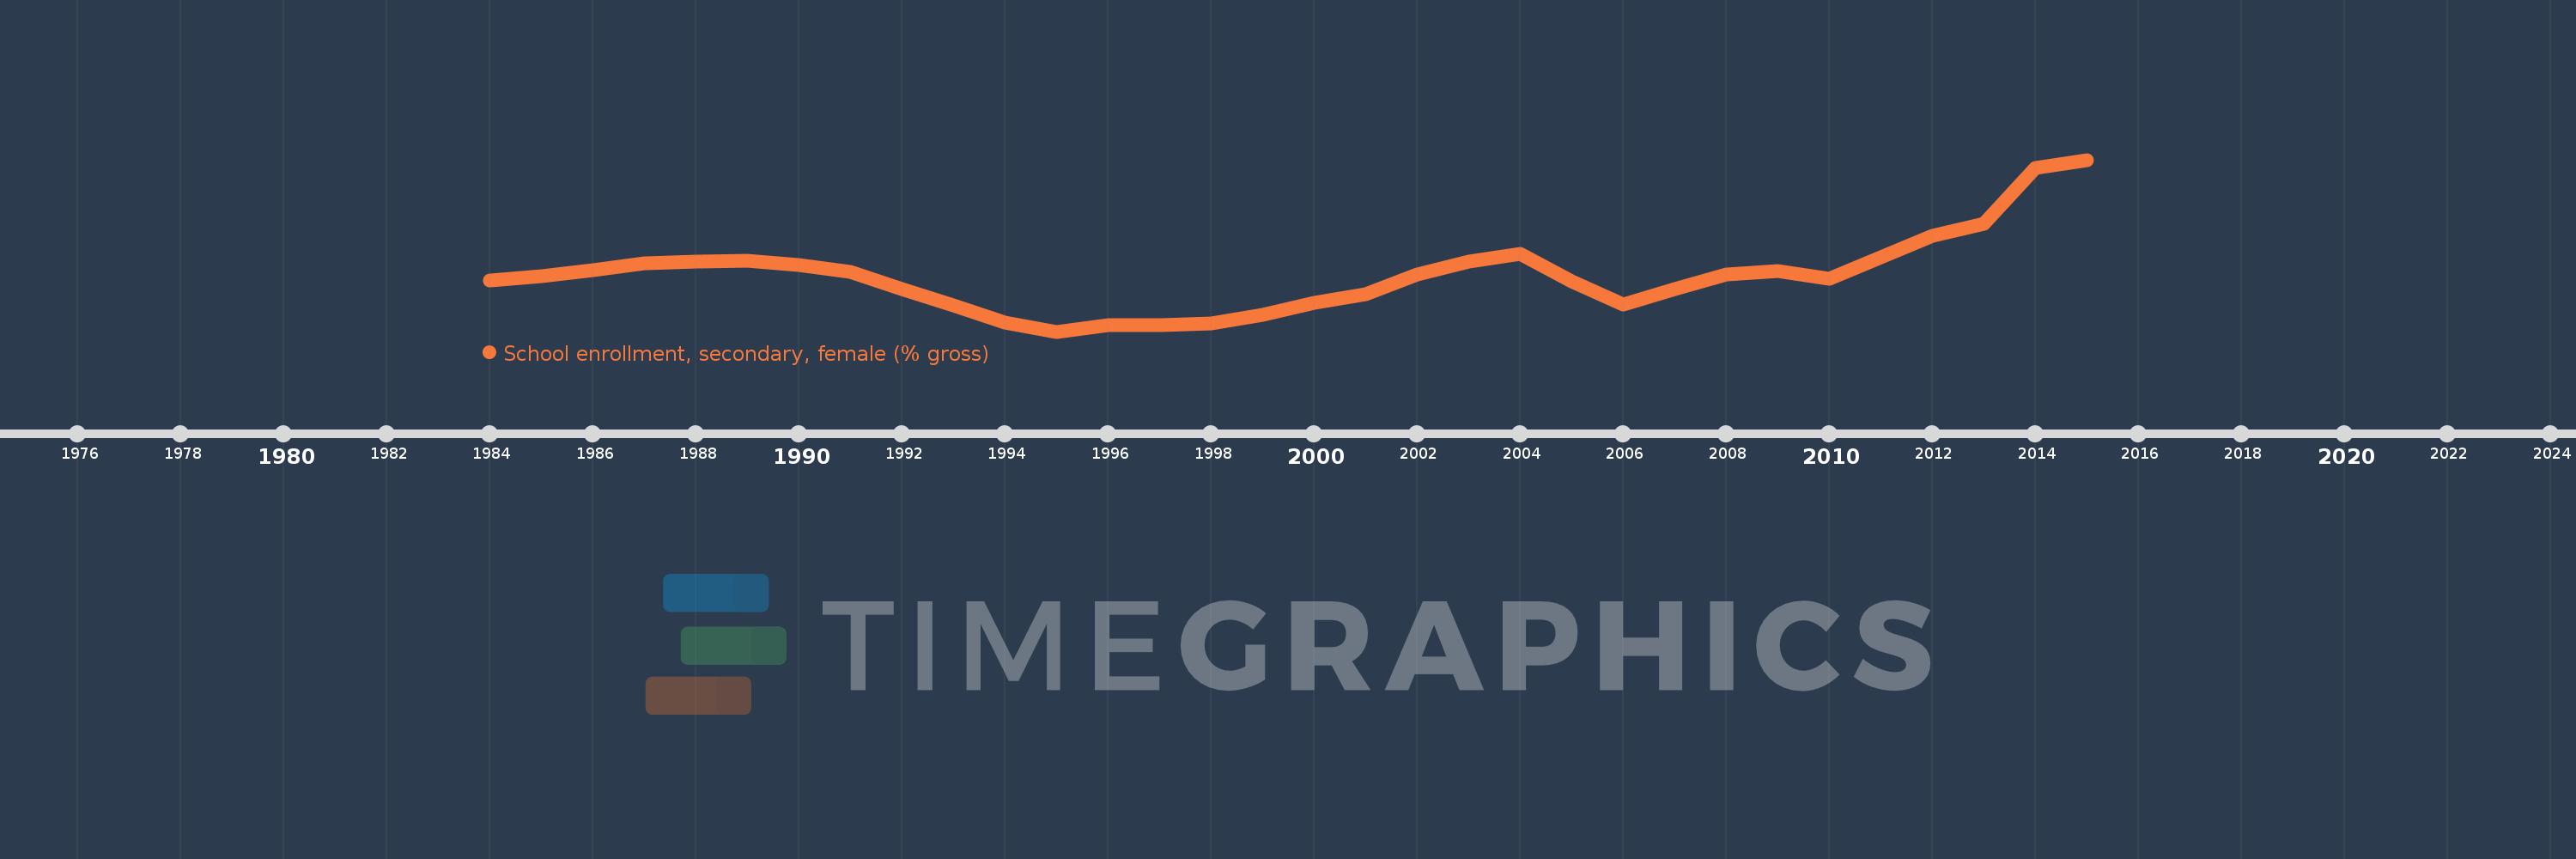
School enrollment, secondary, female (% gross)
2015,2014,2013,2012,2011,2010,2009,2008,2007,2006,2005,2004,2003,2002,2001,2000,1999,1998,1997,1996,1995,1994,1993,1992,1991,1990,1989,1988,1987,1986,1985,1984
This statistics in other country:
AfghanistanAlbaniaAlgeriaAndorraAngolaAntigua and BarbudaArab WorldArgentinaArmeniaArubaAustraliaAustriaAzerbaijanBahamas, TheBahrainBangladeshBarbadosBelarusBelgiumBelizeBeninBermudaBhutanBoliviaBosnia and HerzegovinaBotswanaBrazilBrunei DarussalamBulgariaBurkina FasoBurundiCabo VerdeCambodiaCameroonCanadaCaribbean small statesCentral African RepublicCentral Europe and the BalticsChadChileChinaColombiaComorosCongo, Dem. Rep.Congo, Rep.Costa RicaCote d'IvoireCroatiaCubaCuracaoCyprusCzech RepublicDenmarkDjiboutiDominicaDominican RepublicEarly-demographic dividendEast Asia & PacificEast Asia & Pacific (excluding high income)East Asia & Pacific (IDA & IBRD countries)EcuadorEgypt, Arab Rep.El SalvadorEquatorial GuineaEritreaEstoniaEthiopiaEuro areaEurope & Central AsiaEurope & Central Asia (excluding high income)Europe & Central Asia (IDA & IBRD countries)European UnionFijiFinlandFragile and conflict affected situationsFranceGabonGambia, TheGeorgiaGermanyGhanaGreeceGrenadaGuatemalaGuineaGuinea-BissauGuyanaHeavily indebted poor countries (HIPC)High incomeHondurasHong Kong SAR, ChinaHungaryIBRD onlyIcelandIDA & IBRD totalIDA blendIDA onlyIDA totalIndiaIndonesiaIran, Islamic Rep.IraqIrelandIsraelItalyJamaicaJapanJordanKazakhstanKenyaKiribatiKorea, Dem. People’s Rep.Korea, Rep.KuwaitKyrgyz RepublicLao PDRLate-demographic dividendLatin America & Caribbean Latin America & Caribbean (excluding high income)Latin America & the Caribbean (IDA & IBRD countries)LatviaLeast developed countries: UN classificationLebanonLesothoLiberiaLibyaLiechtensteinLithuaniaLow & middle incomeLow incomeLower middle incomeLuxembourgMacao SAR, ChinaMacedonia, FYRMadagascarMalawiMaldivesMaliMaltaMarshall IslandsMauritaniaMauritiusMexicoMicronesia, Fed. Sts.Middle East & North AfricaMiddle East & North Africa (excluding high income)Middle East & North Africa (IDA & IBRD countries)Middle incomeMoldovaMongoliaMontenegroMoroccoMozambiqueMyanmarNamibiaNauruNepalNetherlandsNew ZealandNicaraguaNigerNigeriaNorth AmericaNorwayOECD membersOmanOther small statesPacific island small statesPakistanPalauPanamaPapua New GuineaParaguayPeruPhilippinesPolandPortugalPost-demographic dividendPre-demographic dividendPuerto RicoQatarRomaniaRussian FederationRwandaSamoaSan MarinoSao Tome and PrincipeSaudi ArabiaSenegalSerbiaSeychellesSierra LeoneSlovak RepublicSloveniaSmall statesSolomon IslandsSomaliaSouth AfricaSouth AsiaSouth Asia (IDA & IBRD)SpainSri LankaSt. Kitts and NevisSt. LuciaSt. Vincent and the GrenadinesSub-Saharan Africa Sub-Saharan Africa (excluding high income)Sub-Saharan Africa (IDA & IBRD countries)SudanSurinameSwazilandSwedenSwitzerlandSyrian Arab RepublicTajikistanTanzaniaThailandTimor-LesteTogoTongaTrinidad and TobagoTunisiaTurkeyTurkmenistanTuvaluUgandaUkraineUnited Arab EmiratesUnited KingdomUnited StatesUpper middle incomeUruguayUzbekistanVanuatuVenezuela, RBVietnamWest Bank and GazaWorldYemen, Rep.ZambiaZimbabwe Timeline:
This timeline shows a graph from 1984 to 2015 of Europe & Central Asia (excluding high income). No data until 1983. Number of actual observations by date: 32.
Source name:
World Development Indicators
Source organization:
United Nations Educational, Scientific, and Cultural Organization (UNESCO) Institute for Statistics.
Categories, topics:
Education, Gender
Last updated:
apr 23, 2017
Indicators value changes by year
Maximum:
97.348
jan 1, 2015
At the date of observation
Value
Absolute change
Change from previous value
jan 1, 1984
86.843
+86.843
0.0%
jan 1, 1985
87.203
+0.36
0.41%
jan 1, 1986
87.701
+0.498
0.57%
jan 1, 1987
88.347
+0.646
0.74%
jan 1, 1988
88.473
+0.126
0.14%
jan 1, 1989
88.539
+0.067
0.08%
jan 1, 1990
88.167
-0.372
-0.42%
jan 1, 1991
87.538
-0.629
-0.71%
jan 1, 1992
86.063
-1.475
-1.68%
jan 1, 1993
84.66
-1.403
-1.63%
jan 1, 1994
83.171
-1.49
-1.76%
jan 1, 1995
82.35
-0.82
-0.99%
jan 1, 1996
82.888
+0.538
0.65%
jan 1, 1997
82.888
0.0
0.0%
jan 1, 1998
83.092
+0.204
0.25%
jan 1, 1999
83.811
+0.719
0.87%
jan 1, 2000
84.872
+1.06
1.27%
jan 1, 2001
85.633
+0.762
0.9%
jan 1, 2002
87.36
+1.727
2.02%
jan 1, 2003
88.49
+1.13
1.29%
jan 1, 2004
89.173
+0.683
0.77%
jan 1, 2005
86.711
-2.462
-2.76%
jan 1, 2006
84.714
-1.997
-2.3%
jan 1, 2007
86.092
+1.378
1.63%
jan 1, 2008
87.328
+1.236
1.44%
jan 1, 2009
87.639
+0.311
0.36%
jan 1, 2010
86.963
-0.676
-0.77%
jan 1, 2011
88.867
+1.905
2.19%
jan 1, 2012
90.701
+1.833
2.06%
jan 1, 2013
91.754
+1.054
1.16%
jan 1, 2014
96.636
+4.882
5.32%
jan 1, 2015
97.348
+0.712
0.74%
Ranking of countries by current statistics by years


Comments: