29
/
en
AIzaSyAYiBZKx7MnpbEhh9jyipgxe19OcubqV5w
April 1, 2024
153059
Hungary
HUN
true
2
1
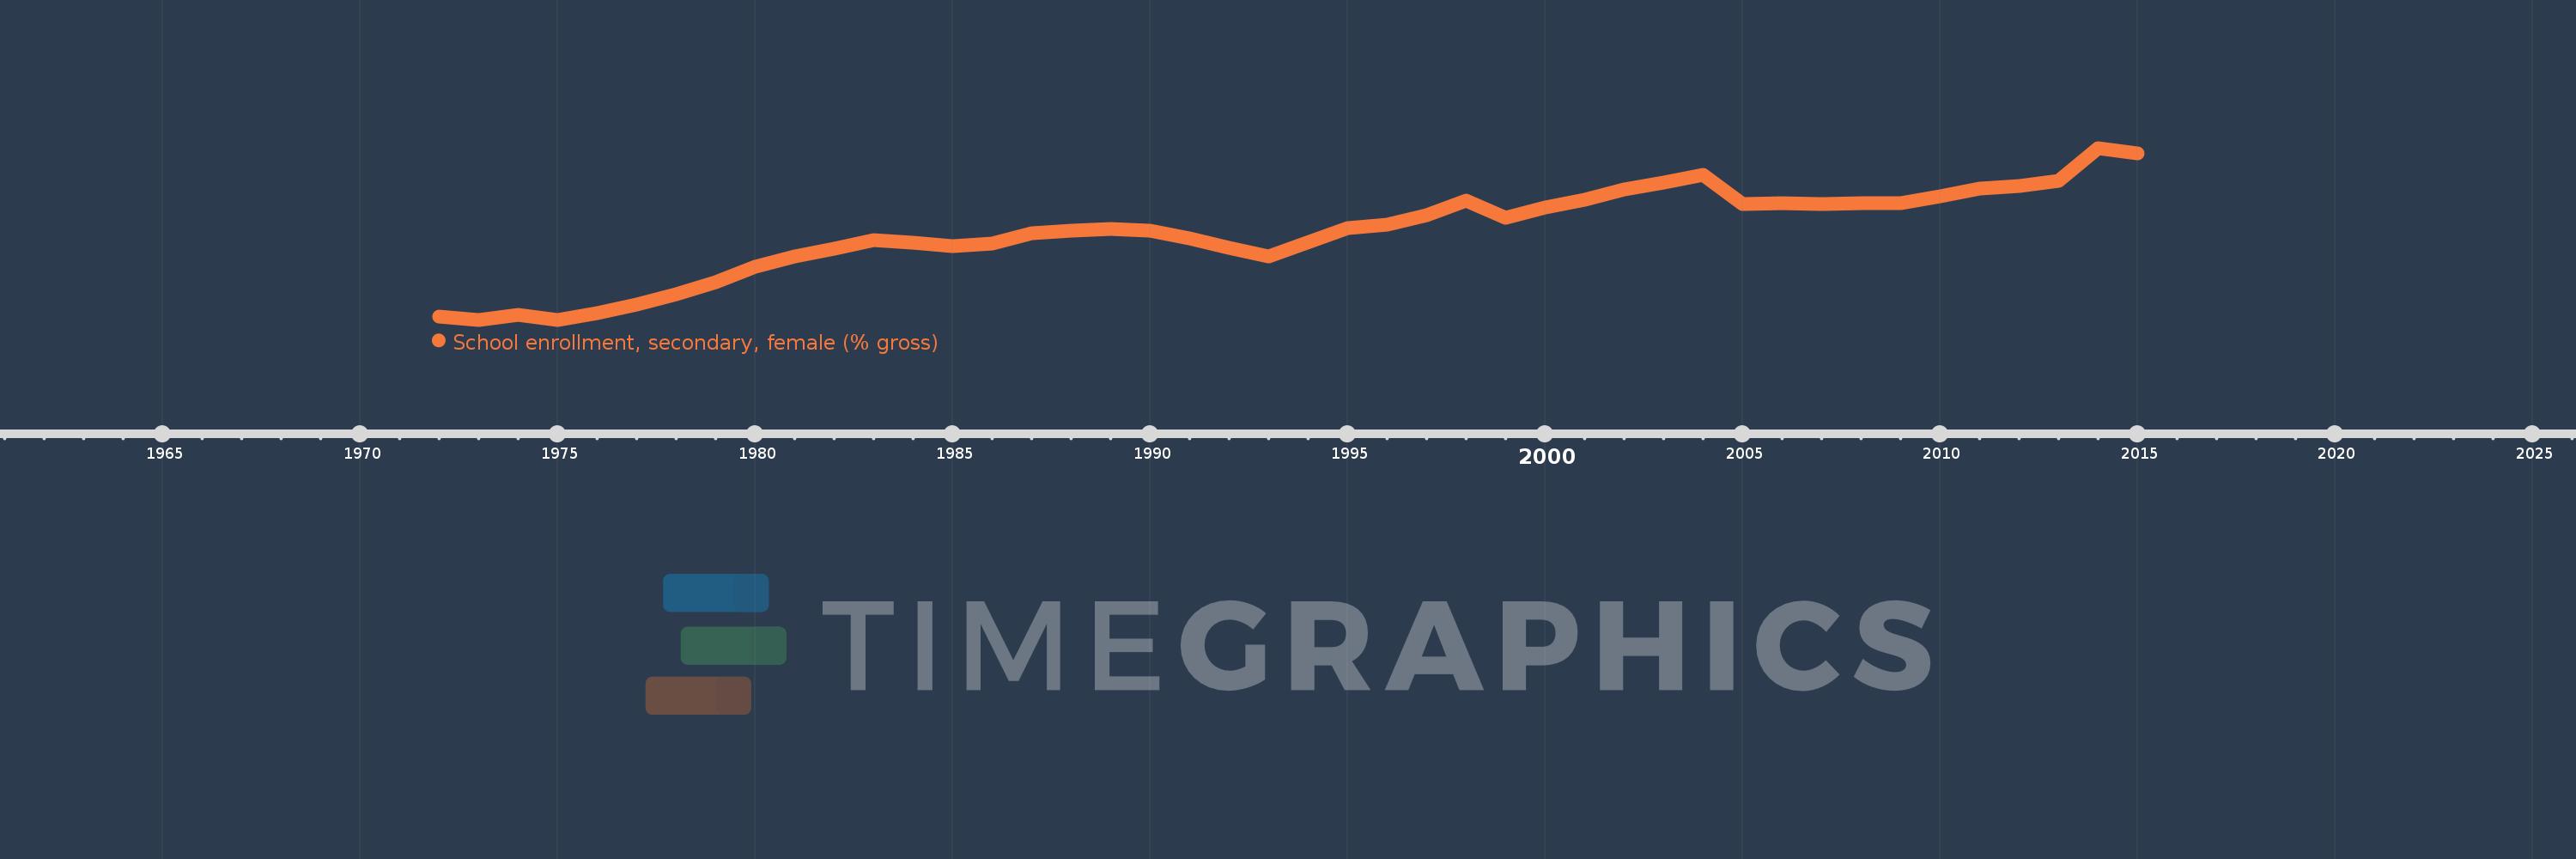
School enrollment, secondary, female (% gross)
2015,2014,2013,2012,2011,2010,2009,2008,2007,2006,2005,2004,2003,2002,2001,2000,1999,1998,1997,1996,1995,1993,1992,1991,1990,1989,1988,1987,1986,1985,1984,1983,1982,1981,1980,1979,1978,1977,1976,1975,1974,1973,1972
This statistics in other country:
AfghanistanAlbaniaAlgeriaAndorraAngolaAntigua and BarbudaArab WorldArgentinaArmeniaArubaAustraliaAustriaAzerbaijanBahamas, TheBahrainBangladeshBarbadosBelarusBelgiumBelizeBeninBermudaBhutanBoliviaBosnia and HerzegovinaBotswanaBrazilBrunei DarussalamBulgariaBurkina FasoBurundiCabo VerdeCambodiaCameroonCanadaCaribbean small statesCentral African RepublicCentral Europe and the BalticsChadChileChinaColombiaComorosCongo, Dem. Rep.Congo, Rep.Costa RicaCote d'IvoireCroatiaCubaCuracaoCyprusCzech RepublicDenmarkDjiboutiDominicaDominican RepublicEarly-demographic dividendEast Asia & PacificEast Asia & Pacific (excluding high income)East Asia & Pacific (IDA & IBRD countries)EcuadorEgypt, Arab Rep.El SalvadorEquatorial GuineaEritreaEstoniaEthiopiaEuro areaEurope & Central AsiaEurope & Central Asia (excluding high income)Europe & Central Asia (IDA & IBRD countries)European UnionFijiFinlandFragile and conflict affected situationsFranceGabonGambia, TheGeorgiaGermanyGhanaGreeceGrenadaGuatemalaGuineaGuinea-BissauGuyanaHeavily indebted poor countries (HIPC)High incomeHondurasHong Kong SAR, ChinaHungaryIBRD onlyIcelandIDA & IBRD totalIDA blendIDA onlyIDA totalIndiaIndonesiaIran, Islamic Rep.IraqIrelandIsraelItalyJamaicaJapanJordanKazakhstanKenyaKiribatiKorea, Dem. People’s Rep.Korea, Rep.KuwaitKyrgyz RepublicLao PDRLate-demographic dividendLatin America & Caribbean Latin America & Caribbean (excluding high income)Latin America & the Caribbean (IDA & IBRD countries)LatviaLeast developed countries: UN classificationLebanonLesothoLiberiaLibyaLiechtensteinLithuaniaLow & middle incomeLow incomeLower middle incomeLuxembourgMacao SAR, ChinaMacedonia, FYRMadagascarMalawiMaldivesMaliMaltaMarshall IslandsMauritaniaMauritiusMexicoMicronesia, Fed. Sts.Middle East & North AfricaMiddle East & North Africa (excluding high income)Middle East & North Africa (IDA & IBRD countries)Middle incomeMoldovaMongoliaMontenegroMoroccoMozambiqueMyanmarNamibiaNauruNepalNetherlandsNew ZealandNicaraguaNigerNigeriaNorth AmericaNorwayOECD membersOmanOther small statesPacific island small statesPakistanPalauPanamaPapua New GuineaParaguayPeruPhilippinesPolandPortugalPost-demographic dividendPre-demographic dividendPuerto RicoQatarRomaniaRussian FederationRwandaSamoaSan MarinoSao Tome and PrincipeSaudi ArabiaSenegalSerbiaSeychellesSierra LeoneSlovak RepublicSloveniaSmall statesSolomon IslandsSomaliaSouth AfricaSouth AsiaSouth Asia (IDA & IBRD)SpainSri LankaSt. Kitts and NevisSt. LuciaSt. Vincent and the GrenadinesSub-Saharan Africa Sub-Saharan Africa (excluding high income)Sub-Saharan Africa (IDA & IBRD countries)SudanSurinameSwazilandSwedenSwitzerlandSyrian Arab RepublicTajikistanTanzaniaThailandTimor-LesteTogoTongaTrinidad and TobagoTunisiaTurkeyTurkmenistanTuvaluUgandaUkraineUnited Arab EmiratesUnited KingdomUnited StatesUpper middle incomeUruguayUzbekistanVanuatuVenezuela, RBVietnamWest Bank and GazaWorldYemen, Rep.ZambiaZimbabwe Timeline:
This timeline shows a graph from 1972 to 2015 of Hungary. No data until 1971. Number of actual observations by date: 43.
Source name:
World Development Indicators
Source organization:
United Nations Educational, Scientific, and Cultural Organization (UNESCO) Institute for Statistics.
Categories, topics:
Education, Gender
Last updated:
apr 23, 2017
Indicators value changes by year
Minimum:
69.073
jan 1, 1973
Maximum:
108.326
jan 1, 2014
At the date of observation
Value
Absolute change
Change from previous value
jan 1, 1972
69.876
+69.876
0.0%
jan 1, 1973
69.073
-0.803
-1.15%
jan 1, 1974
70.246
+1.173
1.7%
jan 1, 1975
69.1
-1.145
-1.63%
jan 1, 1976
70.532
+1.431
2.07%
jan 1, 1977
72.615
+2.083
2.95%
jan 1, 1978
74.878
+2.263
3.12%
jan 1, 1979
77.642
+2.765
3.69%
jan 1, 1980
81.216
+3.574
4.6%
jan 1, 1981
83.491
+2.274
2.8%
jan 1, 1982
85.337
+1.847
2.21%
jan 1, 1983
87.209
+1.872
2.19%
jan 1, 1984
86.693
-0.517
-0.59%
jan 1, 1985
85.807
-0.885
-1.02%
jan 1, 1986
86.44
+0.632
0.74%
jan 1, 1987
88.745
+2.305
2.67%
jan 1, 1988
89.362
+0.617
0.69%
jan 1, 1989
89.82
+0.458
0.51%
jan 1, 1990
89.338
-0.482
-0.54%
jan 1, 1991
87.662
-1.676
-1.88%
jan 1, 1992
85.529
-2.133
-2.43%
jan 1, 1993
83.63
-1.899
-2.22%
jan 1, 1995
90.067
+6.437
7.7%
jan 1, 1996
90.764
+0.697
0.77%
jan 1, 1997
93.039
+2.274
2.51%
jan 1, 1998
96.262
+3.224
3.46%
jan 1, 1999
92.408
-3.854
-4.0%
jan 1, 2000
94.69
+2.282
2.47%
jan 1, 2001
96.566
+1.875
1.98%
jan 1, 2002
98.865
+2.3
2.38%
jan 1, 2003
100.474
+1.608
1.63%
jan 1, 2004
102.27
+1.797
1.79%
jan 1, 2005
95.456
-6.815
-6.66%
jan 1, 2006
95.684
+0.229
0.24%
jan 1, 2007
95.444
-0.24
-0.25%
jan 1, 2008
95.73
+0.286
0.3%
jan 1, 2009
95.788
+0.059
0.06%
jan 1, 2010
97.218
+1.429
1.49%
jan 1, 2011
99.116
+1.898
1.95%
jan 1, 2012
99.674
+0.559
0.56%
jan 1, 2013
100.791
+1.117
1.12%
jan 1, 2014
108.326
+7.535
7.48%
jan 1, 2015
107.107
-1.22
-1.13%
Ranking of countries by current statistics by years


Comments: