29
/
en
AIzaSyAYiBZKx7MnpbEhh9jyipgxe19OcubqV5w
April 1, 2024
182536
Luxembourg
LUX
true
2
1
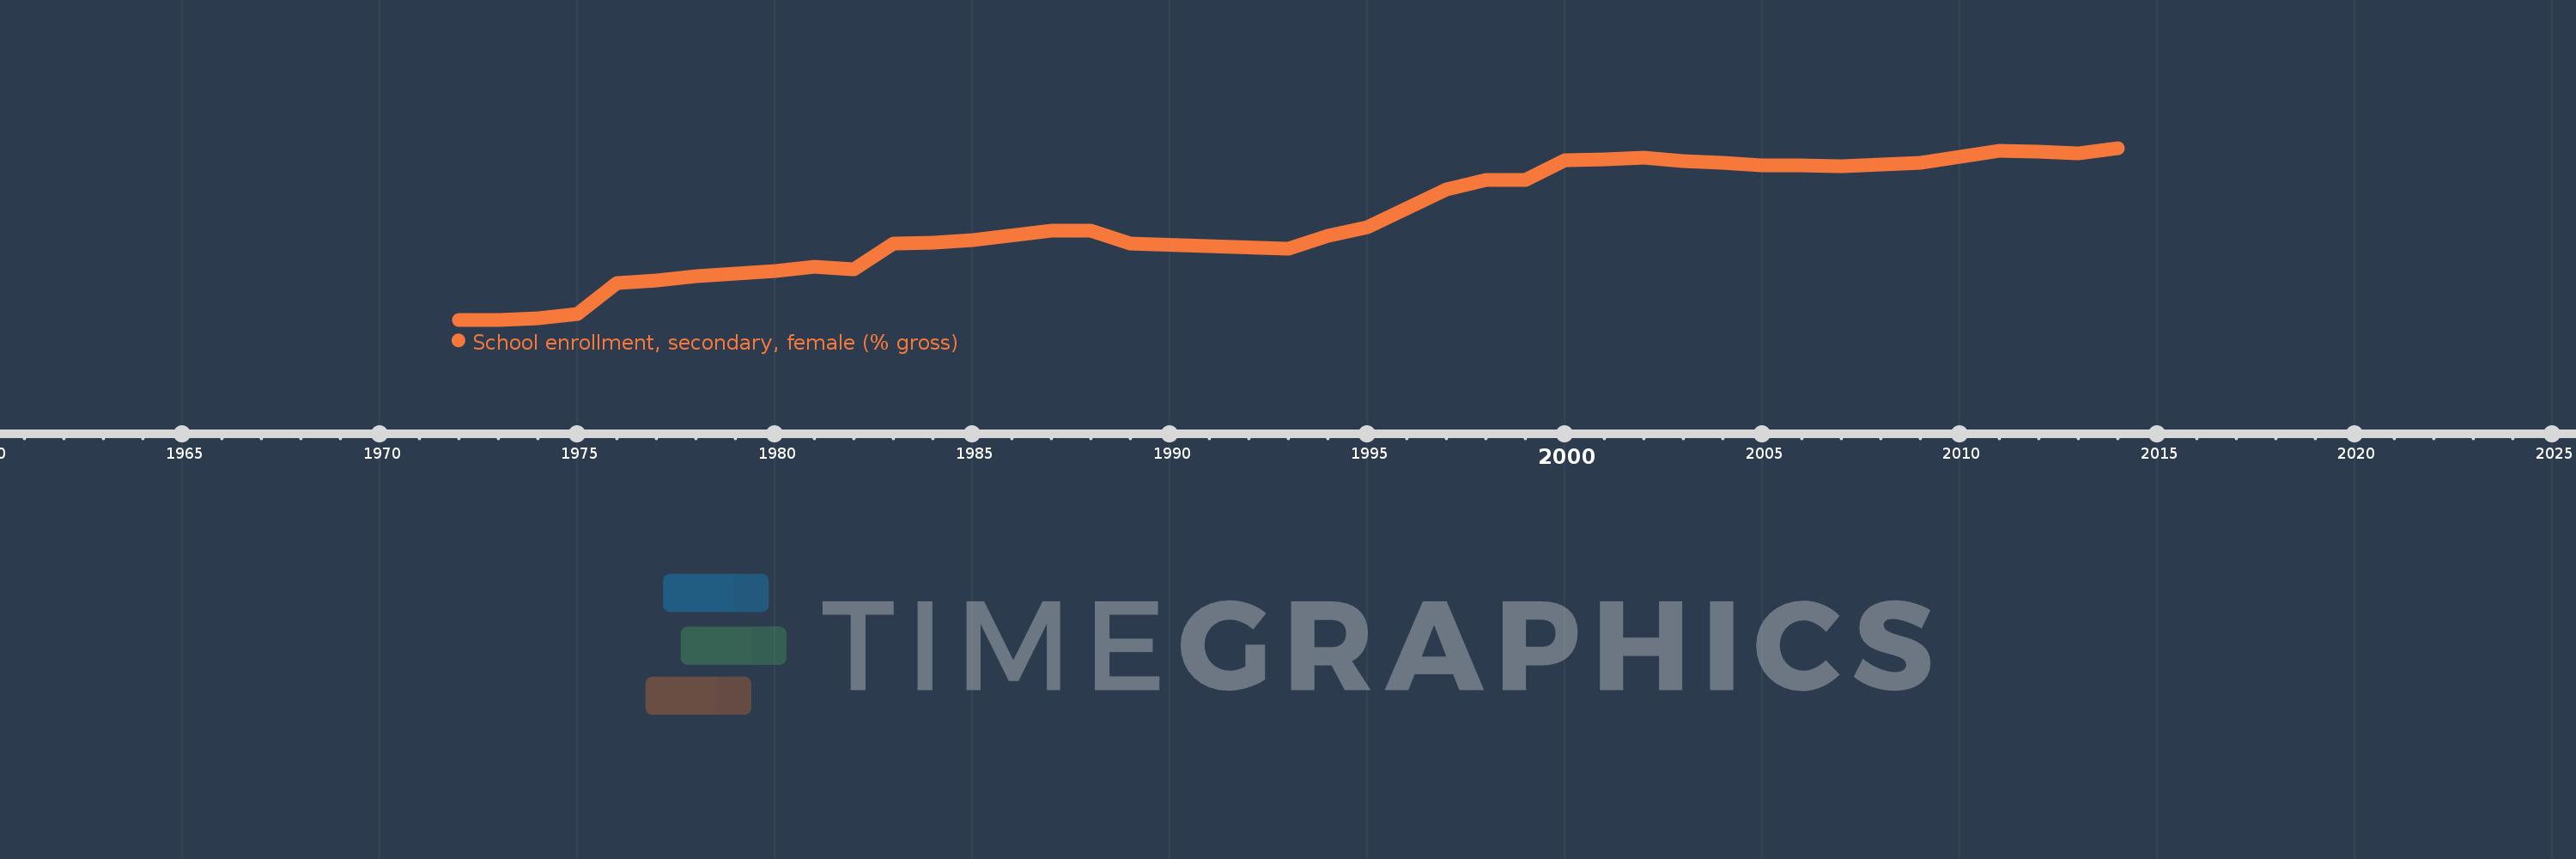
School enrollment, secondary, female (% gross)
2014,2013,2012,2011,2009,2008,2007,2006,2005,2004,2003,2002,2001,2000,1999,1998,1997,1996,1995,1994,1993,1989,1988,1987,1985,1984,1983,1982,1981,1980,1979,1978,1977,1976,1975,1974,1973,1972
This statistics in other country:
AfghanistanAlbaniaAlgeriaAndorraAngolaAntigua and BarbudaArab WorldArgentinaArmeniaArubaAustraliaAustriaAzerbaijanBahamas, TheBahrainBangladeshBarbadosBelarusBelgiumBelizeBeninBermudaBhutanBoliviaBosnia and HerzegovinaBotswanaBrazilBrunei DarussalamBulgariaBurkina FasoBurundiCabo VerdeCambodiaCameroonCanadaCaribbean small statesCentral African RepublicCentral Europe and the BalticsChadChileChinaColombiaComorosCongo, Dem. Rep.Congo, Rep.Costa RicaCote d'IvoireCroatiaCubaCuracaoCyprusCzech RepublicDenmarkDjiboutiDominicaDominican RepublicEarly-demographic dividendEast Asia & PacificEast Asia & Pacific (excluding high income)East Asia & Pacific (IDA & IBRD countries)EcuadorEgypt, Arab Rep.El SalvadorEquatorial GuineaEritreaEstoniaEthiopiaEuro areaEurope & Central AsiaEurope & Central Asia (excluding high income)Europe & Central Asia (IDA & IBRD countries)European UnionFijiFinlandFragile and conflict affected situationsFranceGabonGambia, TheGeorgiaGermanyGhanaGreeceGrenadaGuatemalaGuineaGuinea-BissauGuyanaHeavily indebted poor countries (HIPC)High incomeHondurasHong Kong SAR, ChinaHungaryIBRD onlyIcelandIDA & IBRD totalIDA blendIDA onlyIDA totalIndiaIndonesiaIran, Islamic Rep.IraqIrelandIsraelItalyJamaicaJapanJordanKazakhstanKenyaKiribatiKorea, Dem. People’s Rep.Korea, Rep.KuwaitKyrgyz RepublicLao PDRLate-demographic dividendLatin America & Caribbean Latin America & Caribbean (excluding high income)Latin America & the Caribbean (IDA & IBRD countries)LatviaLeast developed countries: UN classificationLebanonLesothoLiberiaLibyaLiechtensteinLithuaniaLow & middle incomeLow incomeLower middle incomeLuxembourgMacao SAR, ChinaMacedonia, FYRMadagascarMalawiMaldivesMaliMaltaMarshall IslandsMauritaniaMauritiusMexicoMicronesia, Fed. Sts.Middle East & North AfricaMiddle East & North Africa (excluding high income)Middle East & North Africa (IDA & IBRD countries)Middle incomeMoldovaMongoliaMontenegroMoroccoMozambiqueMyanmarNamibiaNauruNepalNetherlandsNew ZealandNicaraguaNigerNigeriaNorth AmericaNorwayOECD membersOmanOther small statesPacific island small statesPakistanPalauPanamaPapua New GuineaParaguayPeruPhilippinesPolandPortugalPost-demographic dividendPre-demographic dividendPuerto RicoQatarRomaniaRussian FederationRwandaSamoaSan MarinoSao Tome and PrincipeSaudi ArabiaSenegalSerbiaSeychellesSierra LeoneSlovak RepublicSloveniaSmall statesSolomon IslandsSomaliaSouth AfricaSouth AsiaSouth Asia (IDA & IBRD)SpainSri LankaSt. Kitts and NevisSt. LuciaSt. Vincent and the GrenadinesSub-Saharan Africa Sub-Saharan Africa (excluding high income)Sub-Saharan Africa (IDA & IBRD countries)SudanSurinameSwazilandSwedenSwitzerlandSyrian Arab RepublicTajikistanTanzaniaThailandTimor-LesteTogoTongaTrinidad and TobagoTunisiaTurkeyTurkmenistanTuvaluUgandaUkraineUnited Arab EmiratesUnited KingdomUnited StatesUpper middle incomeUruguayUzbekistanVanuatuVenezuela, RBVietnamWest Bank and GazaWorldYemen, Rep.ZambiaZimbabwe Timeline:
This timeline shows a graph from 1972 to 2014 of Luxembourg. No data until 1971. Number of actual observations by date: 38.
Source name:
World Development Indicators
Source organization:
United Nations Educational, Scientific, and Cultural Organization (UNESCO) Institute for Statistics.
Categories, topics:
Education, Gender
Last updated:
apr 23, 2017
Indicators value changes by year
Minimum:
45.738
jan 1, 1972
Maximum:
103.768
jan 1, 2014
At the date of observation
Value
Absolute change
Change from previous value
jan 1, 1972
45.738
+45.738
0.0%
jan 1, 1973
45.758
+0.02
0.04%
jan 1, 1974
46.37
+0.612
1.34%
jan 1, 1975
47.688
+1.318
2.84%
jan 1, 1976
58.105
+10.417
21.84%
jan 1, 1977
59.087
+0.982
1.69%
jan 1, 1978
60.456
+1.369
2.32%
jan 1, 1979
61.345
+0.889
1.47%
jan 1, 1980
62.22
+0.876
1.43%
jan 1, 1981
63.652
+1.431
2.3%
jan 1, 1982
62.682
-0.97
-1.52%
jan 1, 1983
71.407
+8.725
13.92%
jan 1, 1984
71.801
+0.393
0.55%
jan 1, 1985
72.648
+0.847
1.18%
jan 1, 1987
75.726
+3.078
4.24%
jan 1, 1988
75.81
+0.084
0.11%
jan 1, 1989
71.477
-4.333
-5.72%
jan 1, 1993
69.823
-1.653
-2.31%
jan 1, 1994
74.017
+4.194
6.01%
jan 1, 1995
76.917
+2.9
3.92%
jan 1, 1996
83.267
+6.35
8.26%
jan 1, 1997
89.76
+6.493
7.8%
jan 1, 1998
92.989
+3.228
3.6%
jan 1, 1999
92.93
-0.058
-0.06%
jan 1, 2000
99.546
+6.615
7.12%
jan 1, 2001
99.897
+0.352
0.35%
jan 1, 2002
100.427
+0.53
0.53%
jan 1, 2003
99.311
-1.116
-1.11%
jan 1, 2004
98.676
-0.635
-0.64%
jan 1, 2005
97.816
-0.86
-0.87%
jan 1, 2006
97.919
+0.104
0.11%
jan 1, 2007
97.704
-0.216
-0.22%
jan 1, 2008
98.302
+0.598
0.61%
jan 1, 2009
98.77
+0.468
0.48%
jan 1, 2011
102.876
+4.106
4.16%
jan 1, 2012
102.607
-0.269
-0.26%
jan 1, 2013
102.001
-0.606
-0.59%
jan 1, 2014
103.768
+1.767
1.73%
Ranking of countries by current statistics by years


Comments: