29
/
en
AIzaSyAYiBZKx7MnpbEhh9jyipgxe19OcubqV5w
April 1, 2024
142303
Greece
GRC
true
2
1
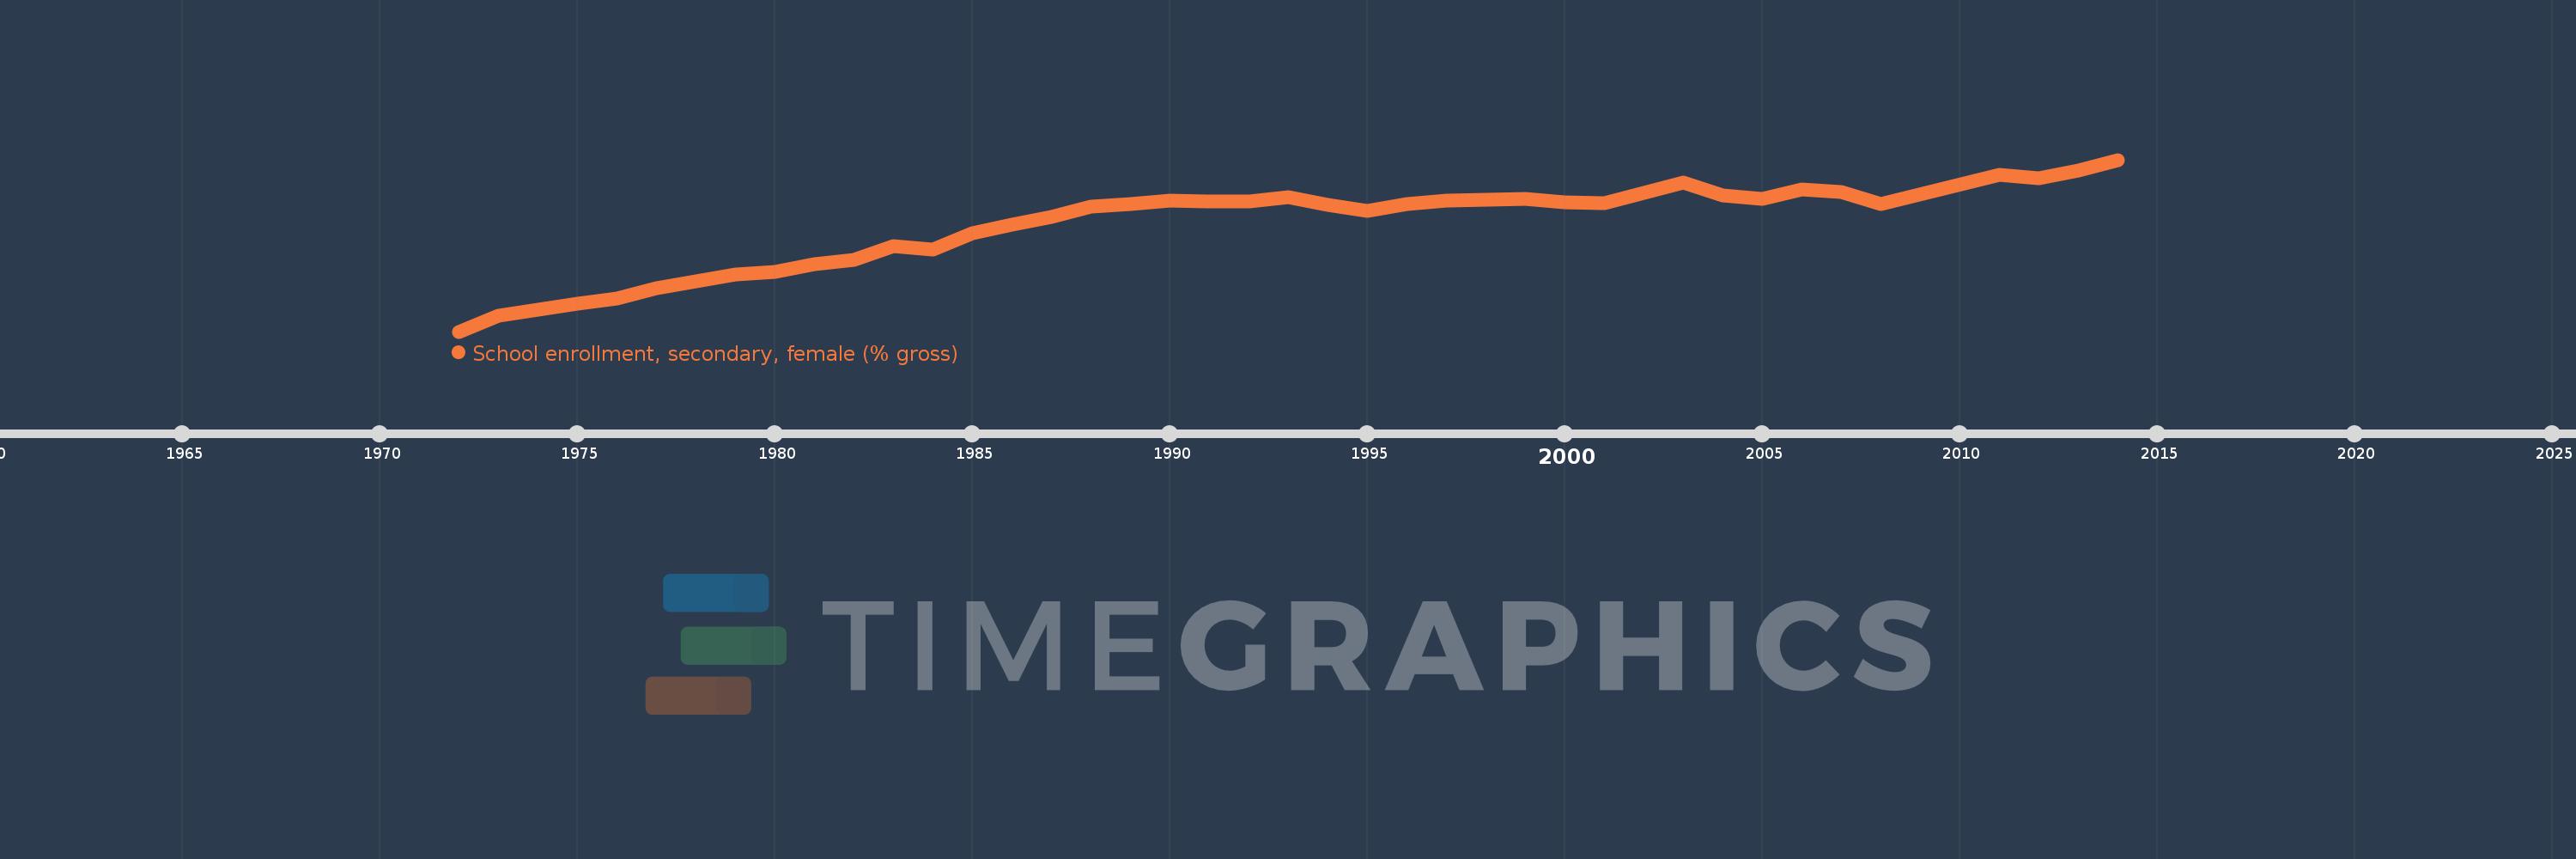
School enrollment, secondary, female (% gross)
2014,2013,2012,2011,2008,2007,2006,2005,2004,2003,2002,2001,2000,1999,1998,1997,1996,1995,1994,1993,1992,1991,1990,1989,1988,1987,1986,1985,1984,1983,1982,1981,1980,1979,1978,1977,1976,1975,1974,1973,1972
This statistics in other country:
AfghanistanAlbaniaAlgeriaAndorraAngolaAntigua and BarbudaArab WorldArgentinaArmeniaArubaAustraliaAustriaAzerbaijanBahamas, TheBahrainBangladeshBarbadosBelarusBelgiumBelizeBeninBermudaBhutanBoliviaBosnia and HerzegovinaBotswanaBrazilBrunei DarussalamBulgariaBurkina FasoBurundiCabo VerdeCambodiaCameroonCanadaCaribbean small statesCentral African RepublicCentral Europe and the BalticsChadChileChinaColombiaComorosCongo, Dem. Rep.Congo, Rep.Costa RicaCote d'IvoireCroatiaCubaCuracaoCyprusCzech RepublicDenmarkDjiboutiDominicaDominican RepublicEarly-demographic dividendEast Asia & PacificEast Asia & Pacific (excluding high income)East Asia & Pacific (IDA & IBRD countries)EcuadorEgypt, Arab Rep.El SalvadorEquatorial GuineaEritreaEstoniaEthiopiaEuro areaEurope & Central AsiaEurope & Central Asia (excluding high income)Europe & Central Asia (IDA & IBRD countries)European UnionFijiFinlandFragile and conflict affected situationsFranceGabonGambia, TheGeorgiaGermanyGhanaGreeceGrenadaGuatemalaGuineaGuinea-BissauGuyanaHeavily indebted poor countries (HIPC)High incomeHondurasHong Kong SAR, ChinaHungaryIBRD onlyIcelandIDA & IBRD totalIDA blendIDA onlyIDA totalIndiaIndonesiaIran, Islamic Rep.IraqIrelandIsraelItalyJamaicaJapanJordanKazakhstanKenyaKiribatiKorea, Dem. People’s Rep.Korea, Rep.KuwaitKyrgyz RepublicLao PDRLate-demographic dividendLatin America & Caribbean Latin America & Caribbean (excluding high income)Latin America & the Caribbean (IDA & IBRD countries)LatviaLeast developed countries: UN classificationLebanonLesothoLiberiaLibyaLiechtensteinLithuaniaLow & middle incomeLow incomeLower middle incomeLuxembourgMacao SAR, ChinaMacedonia, FYRMadagascarMalawiMaldivesMaliMaltaMarshall IslandsMauritaniaMauritiusMexicoMicronesia, Fed. Sts.Middle East & North AfricaMiddle East & North Africa (excluding high income)Middle East & North Africa (IDA & IBRD countries)Middle incomeMoldovaMongoliaMontenegroMoroccoMozambiqueMyanmarNamibiaNauruNepalNetherlandsNew ZealandNicaraguaNigerNigeriaNorth AmericaNorwayOECD membersOmanOther small statesPacific island small statesPakistanPalauPanamaPapua New GuineaParaguayPeruPhilippinesPolandPortugalPost-demographic dividendPre-demographic dividendPuerto RicoQatarRomaniaRussian FederationRwandaSamoaSan MarinoSao Tome and PrincipeSaudi ArabiaSenegalSerbiaSeychellesSierra LeoneSlovak RepublicSloveniaSmall statesSolomon IslandsSomaliaSouth AfricaSouth AsiaSouth Asia (IDA & IBRD)SpainSri LankaSt. Kitts and NevisSt. LuciaSt. Vincent and the GrenadinesSub-Saharan Africa Sub-Saharan Africa (excluding high income)Sub-Saharan Africa (IDA & IBRD countries)SudanSurinameSwazilandSwedenSwitzerlandSyrian Arab RepublicTajikistanTanzaniaThailandTimor-LesteTogoTongaTrinidad and TobagoTunisiaTurkeyTurkmenistanTuvaluUgandaUkraineUnited Arab EmiratesUnited KingdomUnited StatesUpper middle incomeUruguayUzbekistanVanuatuVenezuela, RBVietnamWest Bank and GazaWorldYemen, Rep.ZambiaZimbabwe Timeline:
This timeline shows a graph from 1972 to 2014 of Greece. No data until 1971. Number of actual observations by date: 41.
Source name:
World Development Indicators
Source organization:
United Nations Educational, Scientific, and Cultural Organization (UNESCO) Institute for Statistics.
Categories, topics:
Education, Gender
Last updated:
apr 23, 2017
Indicators value changes by year
Minimum:
56.024
jan 1, 1972
Maximum:
105.939
jan 1, 2014
At the date of observation
Value
Absolute change
Change from previous value
jan 1, 1972
56.024
+56.024
0.0%
jan 1, 1973
60.636
+4.612
8.23%
jan 1, 1974
62.361
+1.726
2.85%
jan 1, 1975
64.227
+1.866
2.99%
jan 1, 1976
65.591
+1.364
2.12%
jan 1, 1977
68.676
+3.085
4.7%
jan 1, 1978
70.748
+2.071
3.02%
jan 1, 1979
72.679
+1.931
2.73%
jan 1, 1980
73.487
+0.808
1.11%
jan 1, 1981
75.53
+2.043
2.78%
jan 1, 1982
76.809
+1.279
1.69%
jan 1, 1983
80.853
+4.044
5.27%
jan 1, 1984
79.918
-0.935
-1.16%
jan 1, 1985
84.72
+4.802
6.01%
jan 1, 1986
87.188
+2.467
2.91%
jan 1, 1987
89.453
+2.266
2.6%
jan 1, 1988
92.406
+2.953
3.3%
jan 1, 1989
93.149
+0.743
0.8%
jan 1, 1990
94.18
+1.03
1.11%
jan 1, 1991
93.953
-0.227
-0.24%
jan 1, 1992
93.726
-0.227
-0.24%
jan 1, 1993
95.041
+1.315
1.4%
jan 1, 1994
92.784
-2.258
-2.38%
jan 1, 1995
91.057
-1.727
-1.86%
jan 1, 1996
93.07
+2.013
2.21%
jan 1, 1997
94.056
+0.987
1.06%
jan 1, 1998
94.317
+0.26
0.28%
jan 1, 1999
94.483
+0.166
0.18%
jan 1, 2000
93.601
-0.882
-0.93%
jan 1, 2001
93.239
-0.362
-0.39%
jan 1, 2002
96.317
+3.078
3.3%
jan 1, 2003
99.276
+2.959
3.07%
jan 1, 2004
95.581
-3.695
-3.72%
jan 1, 2005
94.497
-1.084
-1.13%
jan 1, 2006
97.437
+2.94
3.11%
jan 1, 2007
96.569
-0.868
-0.89%
jan 1, 2008
93.064
-3.505
-3.63%
jan 1, 2011
101.527
+8.463
9.09%
jan 1, 2012
100.568
-0.959
-0.94%
jan 1, 2013
102.81
+2.242
2.23%
jan 1, 2014
105.939
+3.129
3.04%
Ranking of countries by current statistics by years


Comments: