29
/
en
AIzaSyAYiBZKx7MnpbEhh9jyipgxe19OcubqV5w
April 1, 2024
65412
Albania
ALB
true
2
1
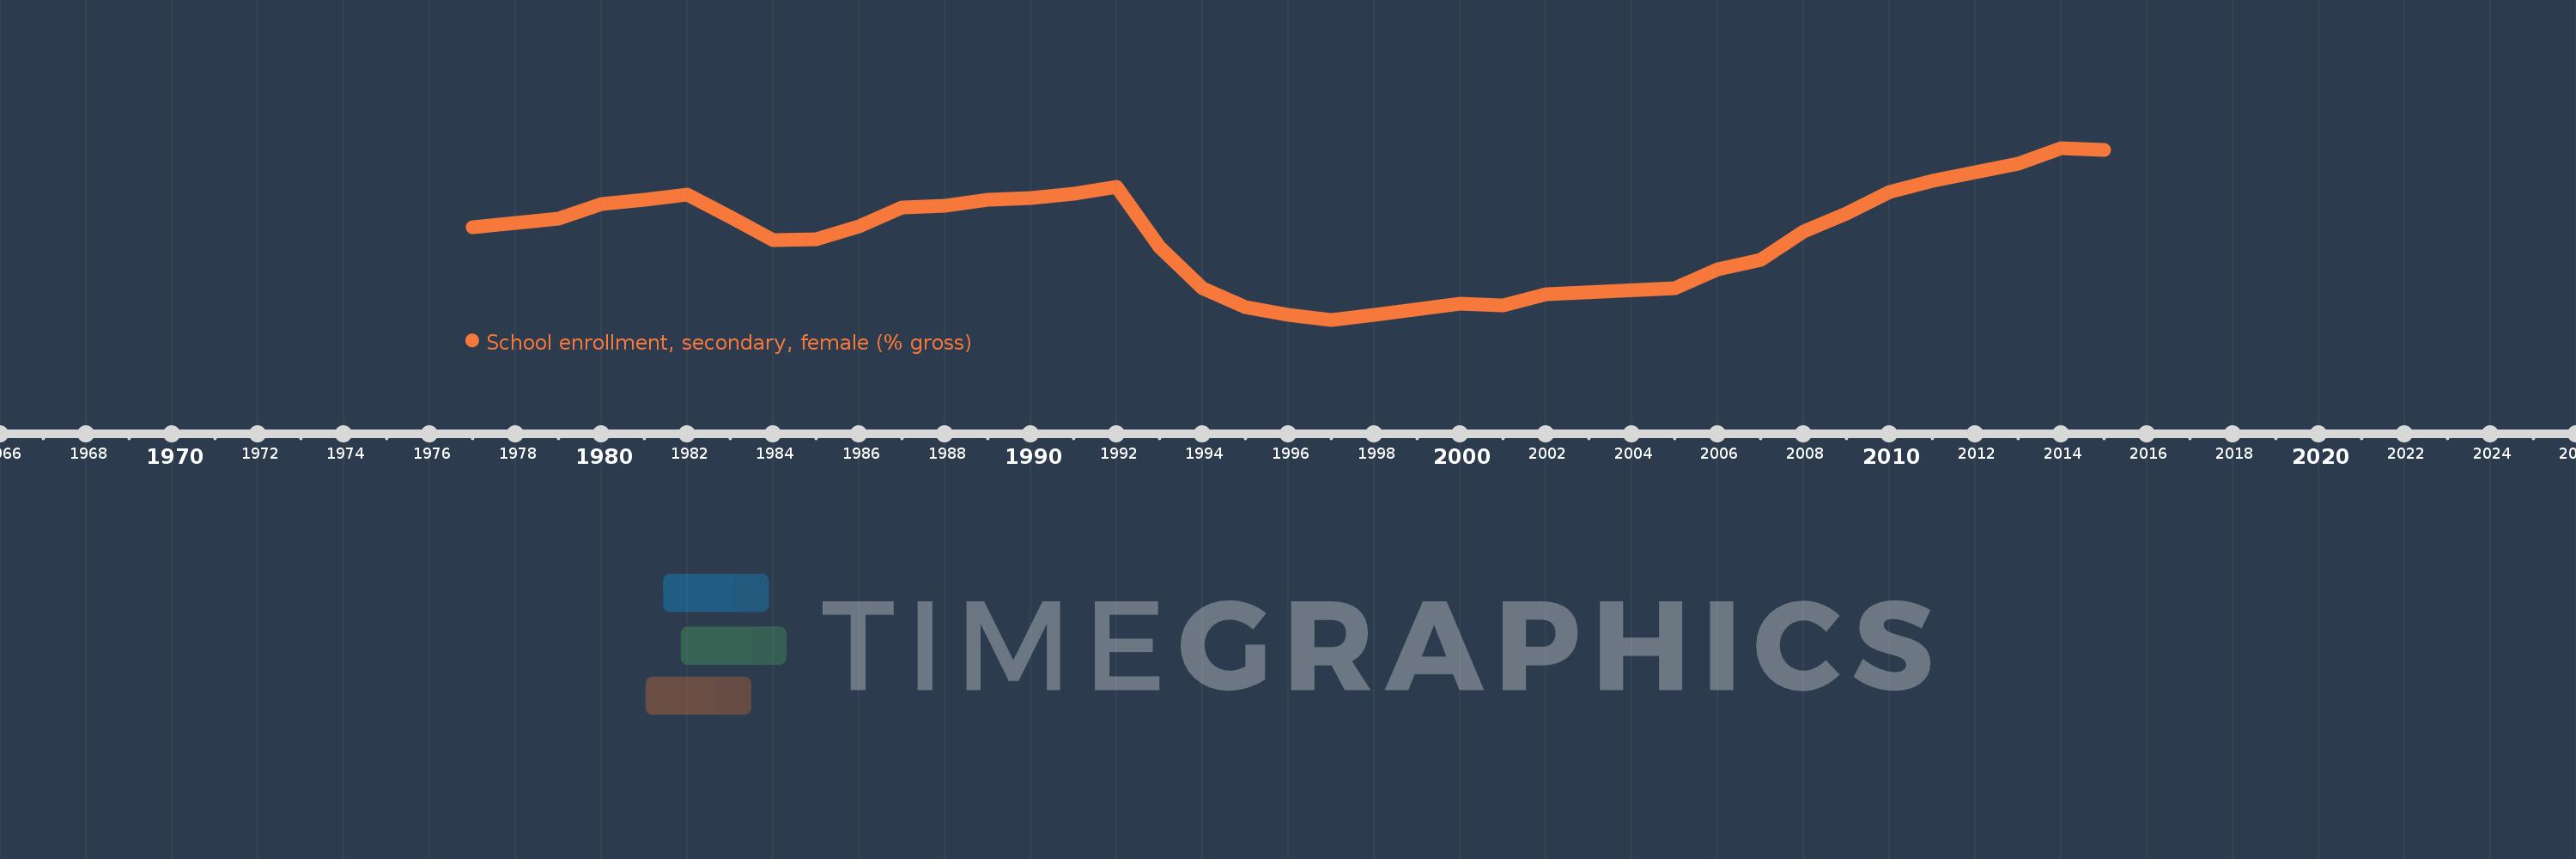
School enrollment, secondary, female (% gross)
2015,2014,2013,2012,2011,2010,2009,2008,2007,2006,2005,2002,2001,2000,1998,1997,1996,1995,1994,1993,1992,1991,1990,1989,1988,1987,1986,1985,1984,1983,1982,1981,1980,1979,1977
This statistics in other country:
AfghanistanAlbaniaAlgeriaAndorraAngolaAntigua and BarbudaArab WorldArgentinaArmeniaArubaAustraliaAustriaAzerbaijanBahamas, TheBahrainBangladeshBarbadosBelarusBelgiumBelizeBeninBermudaBhutanBoliviaBosnia and HerzegovinaBotswanaBrazilBrunei DarussalamBulgariaBurkina FasoBurundiCabo VerdeCambodiaCameroonCanadaCaribbean small statesCentral African RepublicCentral Europe and the BalticsChadChileChinaColombiaComorosCongo, Dem. Rep.Congo, Rep.Costa RicaCote d'IvoireCroatiaCubaCuracaoCyprusCzech RepublicDenmarkDjiboutiDominicaDominican RepublicEarly-demographic dividendEast Asia & PacificEast Asia & Pacific (excluding high income)East Asia & Pacific (IDA & IBRD countries)EcuadorEgypt, Arab Rep.El SalvadorEquatorial GuineaEritreaEstoniaEthiopiaEuro areaEurope & Central AsiaEurope & Central Asia (excluding high income)Europe & Central Asia (IDA & IBRD countries)European UnionFijiFinlandFragile and conflict affected situationsFranceGabonGambia, TheGeorgiaGermanyGhanaGreeceGrenadaGuatemalaGuineaGuinea-BissauGuyanaHeavily indebted poor countries (HIPC)High incomeHondurasHong Kong SAR, ChinaHungaryIBRD onlyIcelandIDA & IBRD totalIDA blendIDA onlyIDA totalIndiaIndonesiaIran, Islamic Rep.IraqIrelandIsraelItalyJamaicaJapanJordanKazakhstanKenyaKiribatiKorea, Dem. People’s Rep.Korea, Rep.KuwaitKyrgyz RepublicLao PDRLate-demographic dividendLatin America & Caribbean Latin America & Caribbean (excluding high income)Latin America & the Caribbean (IDA & IBRD countries)LatviaLeast developed countries: UN classificationLebanonLesothoLiberiaLibyaLiechtensteinLithuaniaLow & middle incomeLow incomeLower middle incomeLuxembourgMacao SAR, ChinaMacedonia, FYRMadagascarMalawiMaldivesMaliMaltaMarshall IslandsMauritaniaMauritiusMexicoMicronesia, Fed. Sts.Middle East & North AfricaMiddle East & North Africa (excluding high income)Middle East & North Africa (IDA & IBRD countries)Middle incomeMoldovaMongoliaMontenegroMoroccoMozambiqueMyanmarNamibiaNauruNepalNetherlandsNew ZealandNicaraguaNigerNigeriaNorth AmericaNorwayOECD membersOmanOther small statesPacific island small statesPakistanPalauPanamaPapua New GuineaParaguayPeruPhilippinesPolandPortugalPost-demographic dividendPre-demographic dividendPuerto RicoQatarRomaniaRussian FederationRwandaSamoaSan MarinoSao Tome and PrincipeSaudi ArabiaSenegalSerbiaSeychellesSierra LeoneSlovak RepublicSloveniaSmall statesSolomon IslandsSomaliaSouth AfricaSouth AsiaSouth Asia (IDA & IBRD)SpainSri LankaSt. Kitts and NevisSt. LuciaSt. Vincent and the GrenadinesSub-Saharan Africa Sub-Saharan Africa (excluding high income)Sub-Saharan Africa (IDA & IBRD countries)SudanSurinameSwazilandSwedenSwitzerlandSyrian Arab RepublicTajikistanTanzaniaThailandTimor-LesteTogoTongaTrinidad and TobagoTunisiaTurkeyTurkmenistanTuvaluUgandaUkraineUnited Arab EmiratesUnited KingdomUnited StatesUpper middle incomeUruguayUzbekistanVanuatuVenezuela, RBVietnamWest Bank and GazaWorldYemen, Rep.ZambiaZimbabwe Timeline:
This timeline shows a graph from 1977 to 2015 of Albania. No data until 1976. Number of actual observations by date: 35.
Source name:
World Development Indicators
Source organization:
United Nations Educational, Scientific, and Cultural Organization (UNESCO) Institute for Statistics.
Categories, topics:
Education, Gender
Last updated:
apr 23, 2017
Indicators value changes by year
Minimum:
67.644
jan 1, 1997
Maximum:
92.842
jan 1, 2014
At the date of observation
Value
Absolute change
Change from previous value
jan 1, 1977
81.177
+81.177
0.0%
jan 1, 1979
82.492
+1.315
1.62%
jan 1, 1980
84.556
+2.064
2.5%
jan 1, 1981
85.299
+0.742
0.88%
jan 1, 1982
86.056
+0.757
0.89%
jan 1, 1983
82.762
-3.294
-3.83%
jan 1, 1984
79.373
-3.389
-4.1%
jan 1, 1985
79.464
+0.092
0.12%
jan 1, 1986
81.334
+1.87
2.35%
jan 1, 1987
84.163
+2.829
3.48%
jan 1, 1988
84.316
+0.153
0.18%
jan 1, 1989
85.272
+0.956
1.13%
jan 1, 1990
85.479
+0.207
0.24%
jan 1, 1991
86.117
+0.638
0.75%
jan 1, 1992
87.095
+0.978
1.14%
jan 1, 1993
78.257
-8.838
-10.15%
jan 1, 1994
72.208
-6.048
-7.73%
jan 1, 1995
69.444
-2.764
-3.83%
jan 1, 1996
68.363
-1.081
-1.56%
jan 1, 1997
67.644
-0.719
-1.05%
jan 1, 1998
68.3
+0.656
0.97%
jan 1, 2000
70.016
+1.716
2.51%
jan 1, 2001
69.723
-0.293
-0.42%
jan 1, 2002
71.442
+1.719
2.47%
jan 1, 2005
72.295
+0.853
1.19%
jan 1, 2006
75.005
+2.711
3.75%
jan 1, 2007
76.461
+1.456
1.94%
jan 1, 2008
80.581
+4.12
5.39%
jan 1, 2009
83.242
+2.661
3.3%
jan 1, 2010
86.383
+3.141
3.77%
jan 1, 2011
87.968
+1.585
1.84%
jan 1, 2012
89.296
+1.328
1.51%
jan 1, 2013
90.558
+1.262
1.41%
jan 1, 2014
92.842
+2.285
2.52%
jan 1, 2015
92.606
-0.236
-0.25%
Ranking of countries by current statistics by years


Comments: