29
/
en
AIzaSyAYiBZKx7MnpbEhh9jyipgxe19OcubqV5w
April 1, 2024
126890
El Salvador
SLV
true
2
1
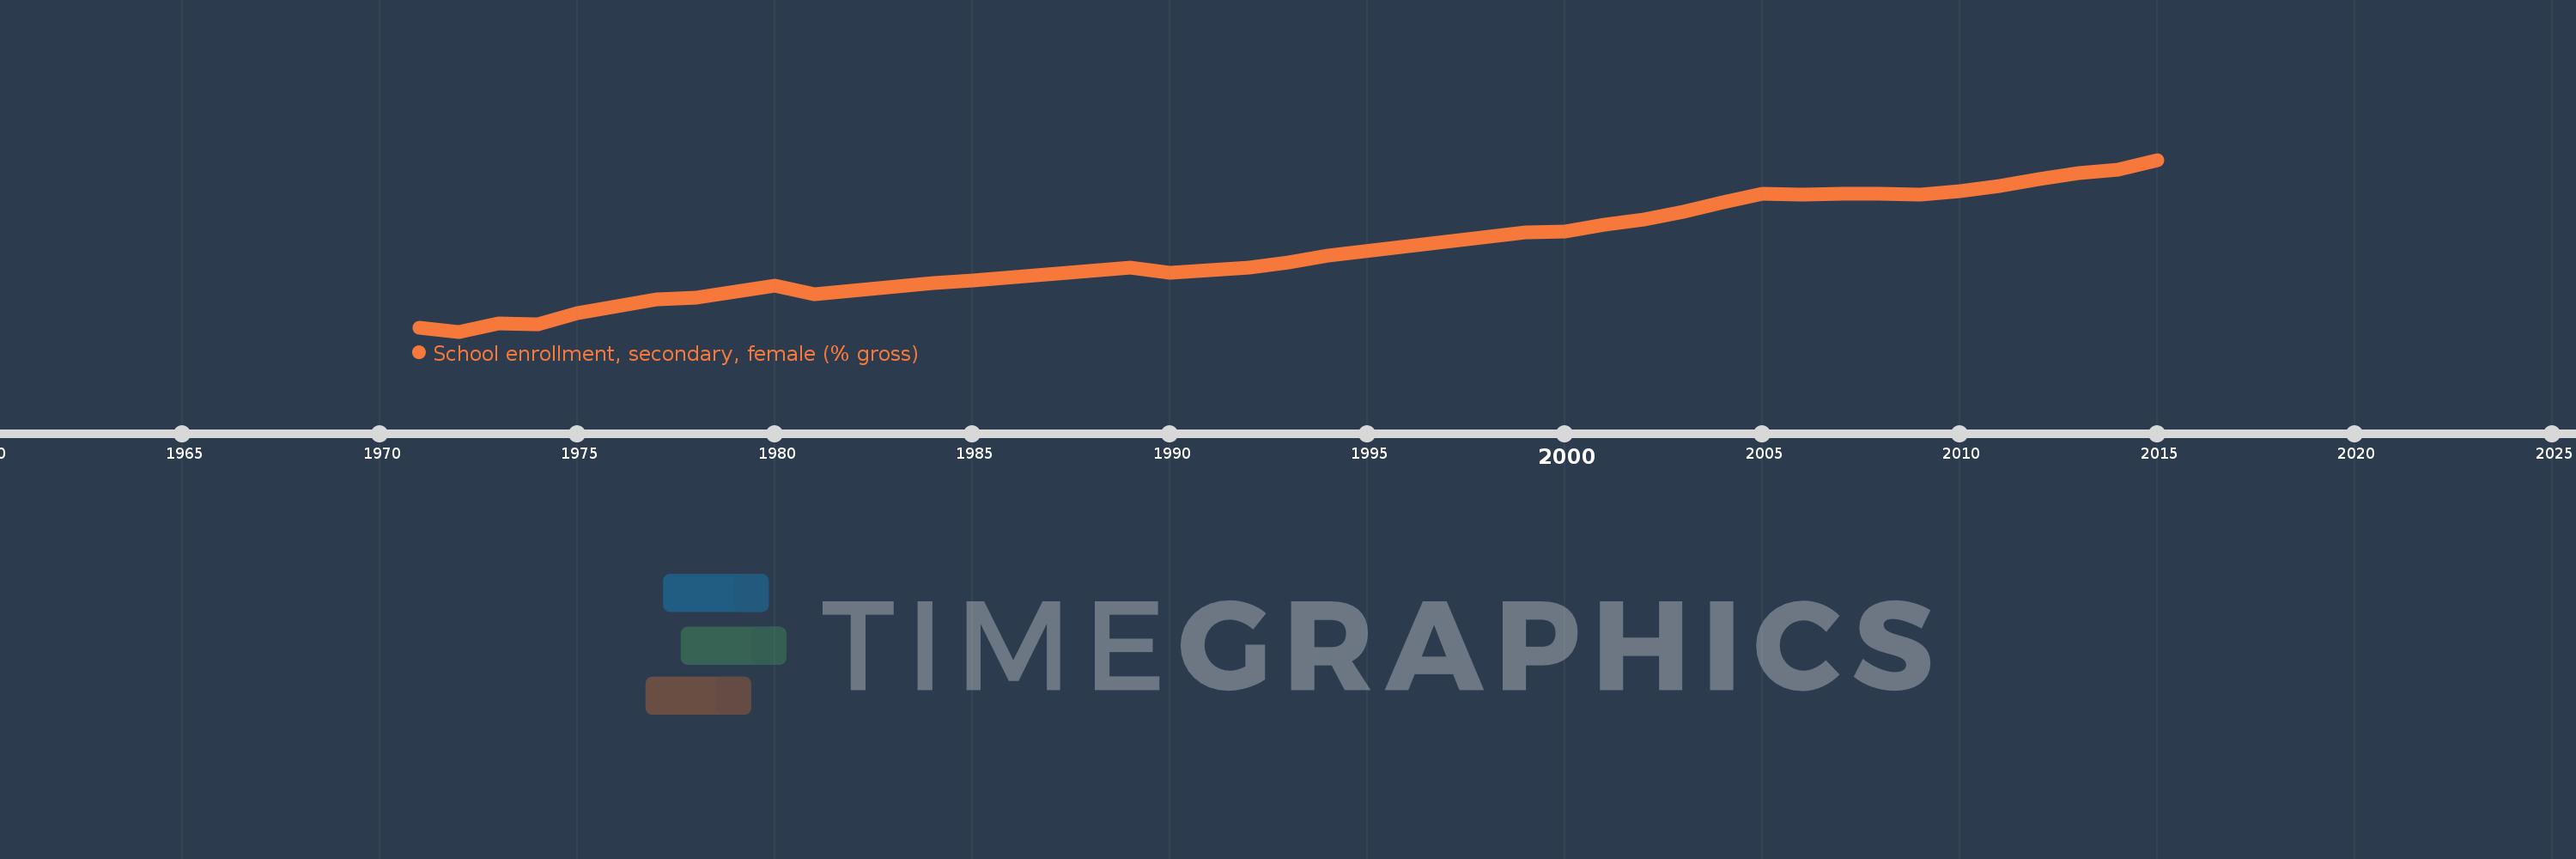
School enrollment, secondary, female (% gross)
2015,2014,2013,2012,2011,2010,2009,2008,2007,2006,2005,2004,2003,2002,2001,2000,1999,1994,1993,1992,1990,1989,1985,1984,1981,1980,1979,1978,1977,1976,1975,1974,1973,1972,1971
This statistics in other country:
AfghanistanAlbaniaAlgeriaAndorraAngolaAntigua and BarbudaArab WorldArgentinaArmeniaArubaAustraliaAustriaAzerbaijanBahamas, TheBahrainBangladeshBarbadosBelarusBelgiumBelizeBeninBermudaBhutanBoliviaBosnia and HerzegovinaBotswanaBrazilBrunei DarussalamBulgariaBurkina FasoBurundiCabo VerdeCambodiaCameroonCanadaCaribbean small statesCentral African RepublicCentral Europe and the BalticsChadChileChinaColombiaComorosCongo, Dem. Rep.Congo, Rep.Costa RicaCote d'IvoireCroatiaCubaCuracaoCyprusCzech RepublicDenmarkDjiboutiDominicaDominican RepublicEarly-demographic dividendEast Asia & PacificEast Asia & Pacific (excluding high income)East Asia & Pacific (IDA & IBRD countries)EcuadorEgypt, Arab Rep.El SalvadorEquatorial GuineaEritreaEstoniaEthiopiaEuro areaEurope & Central AsiaEurope & Central Asia (excluding high income)Europe & Central Asia (IDA & IBRD countries)European UnionFijiFinlandFragile and conflict affected situationsFranceGabonGambia, TheGeorgiaGermanyGhanaGreeceGrenadaGuatemalaGuineaGuinea-BissauGuyanaHeavily indebted poor countries (HIPC)High incomeHondurasHong Kong SAR, ChinaHungaryIBRD onlyIcelandIDA & IBRD totalIDA blendIDA onlyIDA totalIndiaIndonesiaIran, Islamic Rep.IraqIrelandIsraelItalyJamaicaJapanJordanKazakhstanKenyaKiribatiKorea, Dem. People’s Rep.Korea, Rep.KuwaitKyrgyz RepublicLao PDRLate-demographic dividendLatin America & Caribbean Latin America & Caribbean (excluding high income)Latin America & the Caribbean (IDA & IBRD countries)LatviaLeast developed countries: UN classificationLebanonLesothoLiberiaLibyaLiechtensteinLithuaniaLow & middle incomeLow incomeLower middle incomeLuxembourgMacao SAR, ChinaMacedonia, FYRMadagascarMalawiMaldivesMaliMaltaMarshall IslandsMauritaniaMauritiusMexicoMicronesia, Fed. Sts.Middle East & North AfricaMiddle East & North Africa (excluding high income)Middle East & North Africa (IDA & IBRD countries)Middle incomeMoldovaMongoliaMontenegroMoroccoMozambiqueMyanmarNamibiaNauruNepalNetherlandsNew ZealandNicaraguaNigerNigeriaNorth AmericaNorwayOECD membersOmanOther small statesPacific island small statesPakistanPalauPanamaPapua New GuineaParaguayPeruPhilippinesPolandPortugalPost-demographic dividendPre-demographic dividendPuerto RicoQatarRomaniaRussian FederationRwandaSamoaSan MarinoSao Tome and PrincipeSaudi ArabiaSenegalSerbiaSeychellesSierra LeoneSlovak RepublicSloveniaSmall statesSolomon IslandsSomaliaSouth AfricaSouth AsiaSouth Asia (IDA & IBRD)SpainSri LankaSt. Kitts and NevisSt. LuciaSt. Vincent and the GrenadinesSub-Saharan Africa Sub-Saharan Africa (excluding high income)Sub-Saharan Africa (IDA & IBRD countries)SudanSurinameSwazilandSwedenSwitzerlandSyrian Arab RepublicTajikistanTanzaniaThailandTimor-LesteTogoTongaTrinidad and TobagoTunisiaTurkeyTurkmenistanTuvaluUgandaUkraineUnited Arab EmiratesUnited KingdomUnited StatesUpper middle incomeUruguayUzbekistanVanuatuVenezuela, RBVietnamWest Bank and GazaWorldYemen, Rep.ZambiaZimbabwe Timeline:
This timeline shows a graph from 1971 to 2015 of El Salvador. No data until 1970. Number of actual observations by date: 35.
Source name:
World Development Indicators
Source organization:
United Nations Educational, Scientific, and Cultural Organization (UNESCO) Institute for Statistics.
Categories, topics:
Education, Gender
Last updated:
apr 23, 2017
Indicators value changes by year
Minimum:
18.119
jan 1, 1972
Maximum:
81.321
jan 1, 2015
At the date of observation
Value
Absolute change
Change from previous value
jan 1, 1971
19.637
+19.637
0.0%
jan 1, 1972
18.119
-1.518
-7.73%
jan 1, 1973
21.231
+3.112
17.18%
jan 1, 1974
20.961
-0.27
-1.27%
jan 1, 1975
24.982
+4.021
19.18%
jan 1, 1976
27.295
+2.313
9.26%
jan 1, 1977
29.867
+2.572
9.42%
jan 1, 1978
30.661
+0.795
2.66%
jan 1, 1979
32.823
+2.161
7.05%
jan 1, 1980
34.88
+2.057
6.27%
jan 1, 1981
32.018
-2.863
-8.21%
jan 1, 1984
36.03
+4.013
12.53%
jan 1, 1985
37.028
+0.998
2.77%
jan 1, 1989
41.766
+4.739
12.8%
jan 1, 1990
39.803
-1.964
-4.7%
jan 1, 1992
41.773
+1.97
4.95%
jan 1, 1993
43.455
+1.682
4.03%
jan 1, 1994
46.218
+2.763
6.36%
jan 1, 1999
54.767
+8.55
18.5%
jan 1, 2000
54.968
+0.2
0.37%
jan 1, 2001
57.329
+2.361
4.3%
jan 1, 2002
59.298
+1.969
3.44%
jan 1, 2003
62.244
+2.946
4.97%
jan 1, 2004
65.564
+3.32
5.33%
jan 1, 2005
68.922
+3.358
5.12%
jan 1, 2006
68.54
-0.381
-0.55%
jan 1, 2007
68.714
+0.174
0.25%
jan 1, 2008
68.85
+0.135
0.2%
jan 1, 2009
68.397
-0.453
-0.66%
jan 1, 2010
69.643
+1.246
1.82%
jan 1, 2011
71.783
+2.14
3.07%
jan 1, 2012
74.243
+2.459
3.43%
jan 1, 2013
76.559
+2.317
3.12%
jan 1, 2014
77.824
+1.265
1.65%
jan 1, 2015
81.321
+3.497
4.49%
Ranking of countries by current statistics by years


Comments: