29
/
en
AIzaSyAYiBZKx7MnpbEhh9jyipgxe19OcubqV5w
April 1, 2024
61636
Upper middle income
UMC
false
2
1
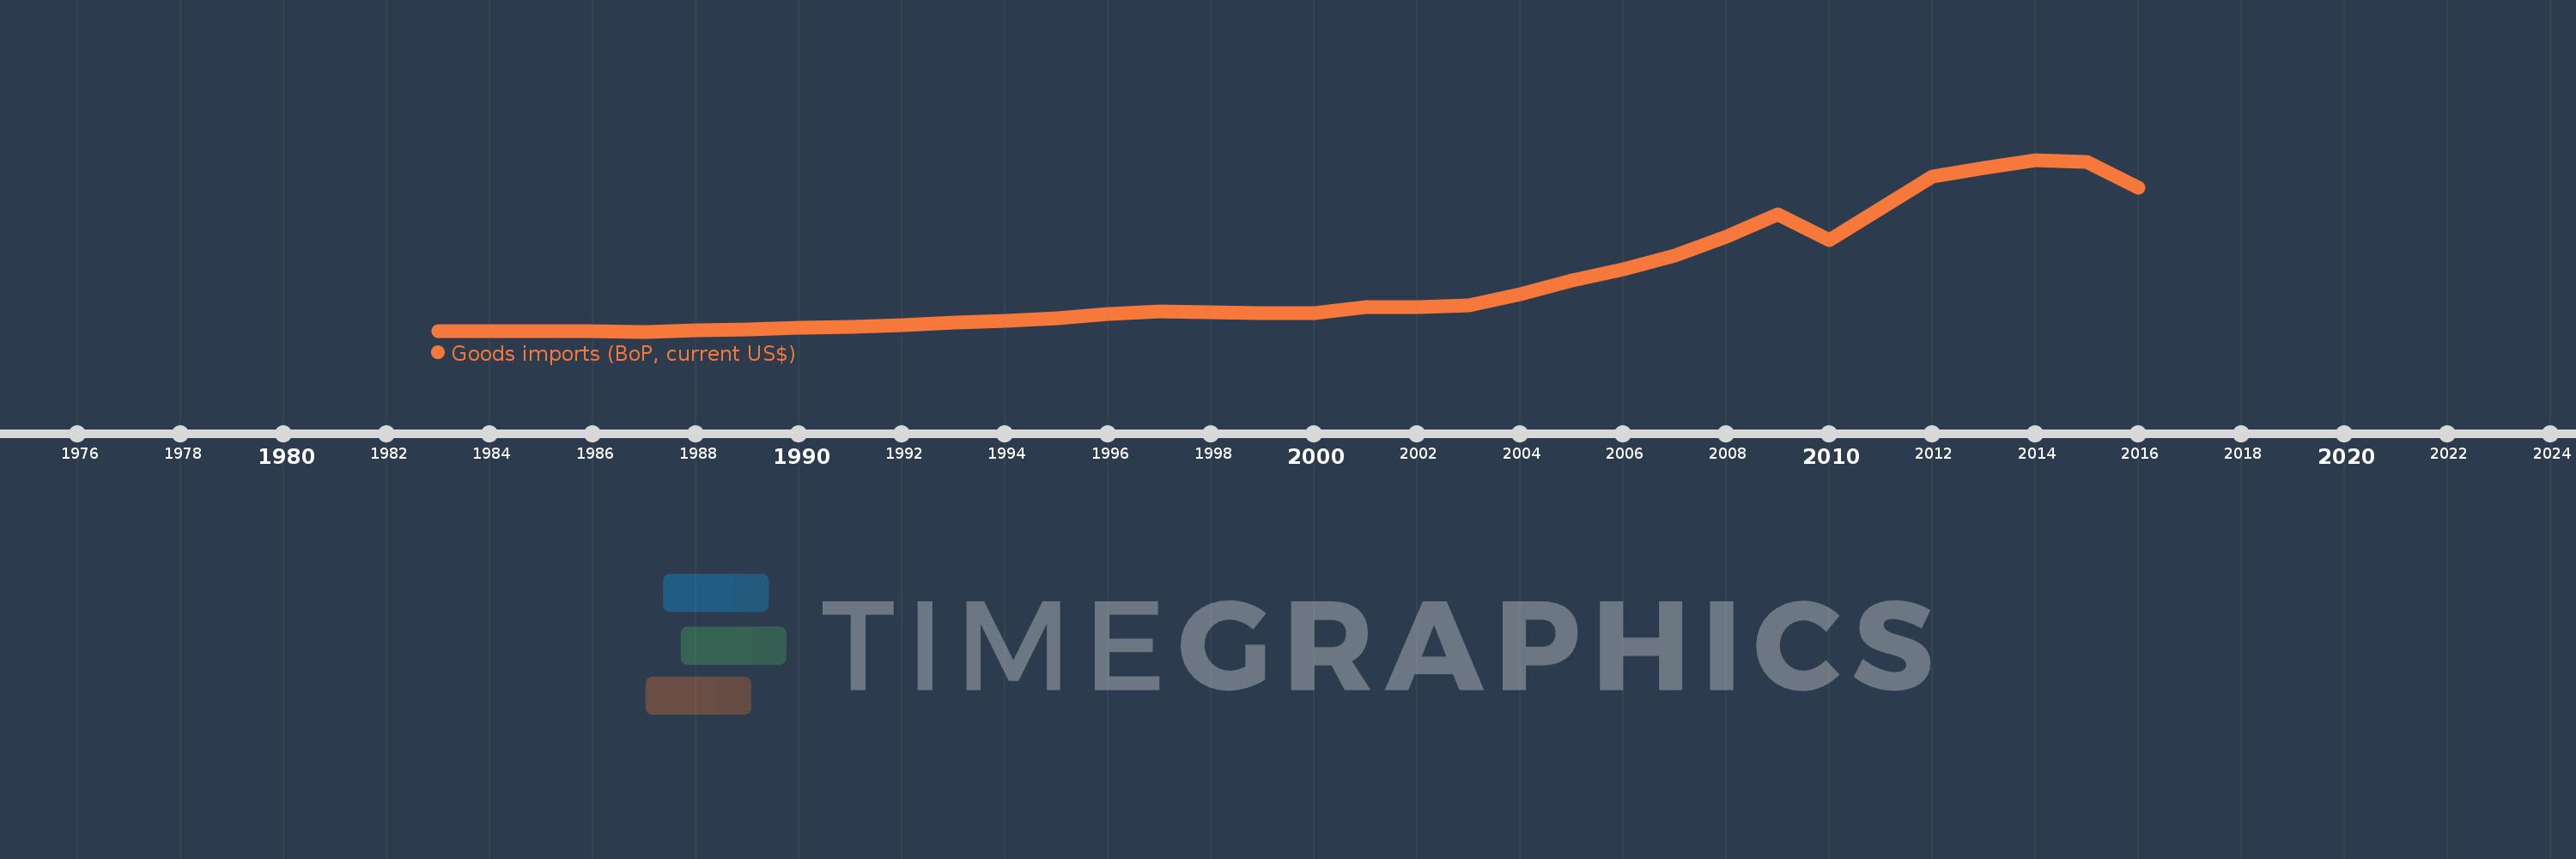
Goods imports (BoP, current US$)
2016,2015,2014,2013,2012,2011,2010,2009,2008,2007,2006,2005,2004,2003,2002,2001,2000,1999,1998,1997,1996,1995,1994,1993,1992,1991,1990,1989,1988,1987,1986,1985,1984,1983
This statistics in other country:
AfghanistanAlbaniaAlgeriaAngolaAntigua and BarbudaArab WorldArgentinaArmeniaArubaAustraliaAustriaAzerbaijanBahamas, TheBahrainBangladeshBarbadosBelarusBelgiumBelizeBeninBermudaBhutanBoliviaBosnia and HerzegovinaBotswanaBrazilBrunei DarussalamBulgariaBurkina FasoBurundiCabo VerdeCambodiaCameroonCanadaCaribbean small statesCentral African RepublicCentral Europe and the BalticsChadChileChinaColombiaComorosCongo, Dem. Rep.Congo, Rep.Costa RicaCote d'IvoireCroatiaCuracaoCyprusCzech RepublicDenmarkDjiboutiDominicaDominican RepublicEarly-demographic dividendEast Asia & PacificEast Asia & Pacific (excluding high income)East Asia & Pacific (IDA & IBRD countries)EcuadorEgypt, Arab Rep.El SalvadorEquatorial GuineaEritreaEstoniaEthiopiaEuro areaEurope & Central AsiaEurope & Central Asia (excluding high income)Europe & Central Asia (IDA & IBRD countries)European UnionFaroe IslandsFijiFinlandFragile and conflict affected situationsFranceFrench PolynesiaGabonGambia, TheGeorgiaGermanyGhanaGreeceGrenadaGuatemalaGuineaGuinea-BissauGuyanaHaitiHeavily indebted poor countries (HIPC)High incomeHondurasHong Kong SAR, ChinaHungaryIBRD onlyIcelandIDA & IBRD totalIDA blendIDA onlyIDA totalIndiaIndonesiaIran, Islamic Rep.IraqIrelandIsraelItalyJamaicaJapanJordanKazakhstanKenyaKiribatiKorea, Rep.KosovoKuwaitKyrgyz RepublicLao PDRLate-demographic dividendLatin America & Caribbean Latin America & Caribbean (excluding high income)Latin America & the Caribbean (IDA & IBRD countries)LatviaLeast developed countries: UN classificationLebanonLesothoLiberiaLibyaLithuaniaLow & middle incomeLow incomeLower middle incomeLuxembourgMacao SAR, ChinaMacedonia, FYRMadagascarMalawiMalaysiaMaldivesMaliMaltaMarshall IslandsMauritaniaMauritiusMexicoMicronesia, Fed. Sts.Middle East & North Africa (excluding high income)Middle East & North Africa (IDA & IBRD countries)Middle incomeMoldovaMongoliaMontenegroMoroccoMozambiqueMyanmarNamibiaNepalNetherlandsNew CaledoniaNew ZealandNicaraguaNigerNigeriaNorth AmericaNorwayOECD membersOmanOther small statesPacific island small statesPakistanPalauPanamaPapua New GuineaParaguayPeruPhilippinesPolandPortugalPost-demographic dividendPre-demographic dividendQatarRomaniaRussian FederationRwandaSamoaSao Tome and PrincipeSaudi ArabiaSenegalSerbiaSeychellesSierra LeoneSingaporeSint Maarten (Dutch part)Slovak RepublicSloveniaSmall statesSolomon IslandsSouth AfricaSouth AsiaSouth Asia (IDA & IBRD)South SudanSpainSri LankaSt. Kitts and NevisSt. LuciaSt. Vincent and the GrenadinesSub-Saharan Africa Sub-Saharan Africa (excluding high income)Sub-Saharan Africa (IDA & IBRD countries)SudanSurinameSwazilandSwedenSwitzerlandSyrian Arab RepublicTajikistanTanzaniaThailandTimor-LesteTogoTongaTrinidad and TobagoTunisiaTurkeyTuvaluUgandaUkraineUnited KingdomUnited StatesUpper middle incomeUruguayVanuatuVenezuela, RBVietnamWest Bank and GazaWorldYemen, Rep.ZambiaZimbabwe Timeline:
This timeline shows a graph from 1983 to 2016 of Upper middle income. No data until 1982. Number of actual observations by date: 34.
Source name:
World Development Indicators
Source organization:
International Monetary Fund, Balance of Payments Statistics Yearbook and data files.
Categories, topics:
Economy & Growth, Trade
Last updated:
apr 23, 2017
Indicators value changes by year
Minimum:
208.025 bln
jan 1, 1987
Maximum:
4.43 trl
jan 1, 2014
At the date of observation
Value
Absolute change
Change from previous value
jan 1, 1983
226.698 bln
+226.698 bln
0.0%
jan 1, 1984
208.09 bln
-18.608 bln
-8.21%
jan 1, 1985
215.339 bln
+7.249 bln
3.48%
jan 1, 1986
217.993 bln
+2.654 bln
1.23%
jan 1, 1987
208.025 bln
-9.967 bln
-4.57%
jan 1, 1988
233.777 bln
+25.751 bln
12.38%
jan 1, 1989
268.525 bln
+34.748 bln
14.86%
jan 1, 1990
295.943 bln
+27.418 bln
10.21%
jan 1, 1991
331.482 bln
+35.539 bln
12.01%
jan 1, 1992
368.578 bln
+37.096 bln
11.19%
jan 1, 1993
421.969 bln
+53.391 bln
14.49%
jan 1, 1994
481.54 bln
+59.571 bln
14.12%
jan 1, 1995
532.088 bln
+50.549 bln
10.5%
jan 1, 1996
634.842 bln
+102.753 bln
19.31%
jan 1, 1997
700.722 bln
+65.88 bln
10.38%
jan 1, 1998
676.564 bln
-24.157 bln
-3.45%
jan 1, 1999
672.358 bln
-4.206 bln
-0.62%
jan 1, 2000
660.644 bln
-11.714 bln
-1.74%
jan 1, 2001
810.932 bln
+150.288 bln
22.75%
jan 1, 2002
808.319 bln
-2.613 bln
-0.32%
jan 1, 2003
842.719 bln
+34.4 bln
4.26%
jan 1, 2004
1.133 trl
+290.069 bln
34.42%
jan 1, 2005
1.472 trl
+339.231 bln
29.95%
jan 1, 2006
1.741 trl
+269.228 bln
18.29%
jan 1, 2007
2.085 trl
+343.638 bln
19.74%
jan 1, 2008
2.532 trl
+447.503 bln
21.46%
jan 1, 2009
3.091 trl
+558.547 bln
22.06%
jan 1, 2010
2.458 trl
-633.163 bln
-20.48%
jan 1, 2011
3.235 trl
+777.005 bln
31.61%
jan 1, 2012
4.028 trl
+792.98 bln
24.51%
jan 1, 2013
4.228 trl
+199.875 bln
4.96%
jan 1, 2014
4.43 trl
+202.016 bln
4.78%
jan 1, 2015
4.377 trl
-52.169 bln
-1.18%
jan 1, 2016
3.74 trl
-637.609 bln
-14.57%
Ranking of countries by current statistics by years


Comments: