29
/
en
AIzaSyAYiBZKx7MnpbEhh9jyipgxe19OcubqV5w
April 1, 2024
201606
Morocco
MAR
true
2
1
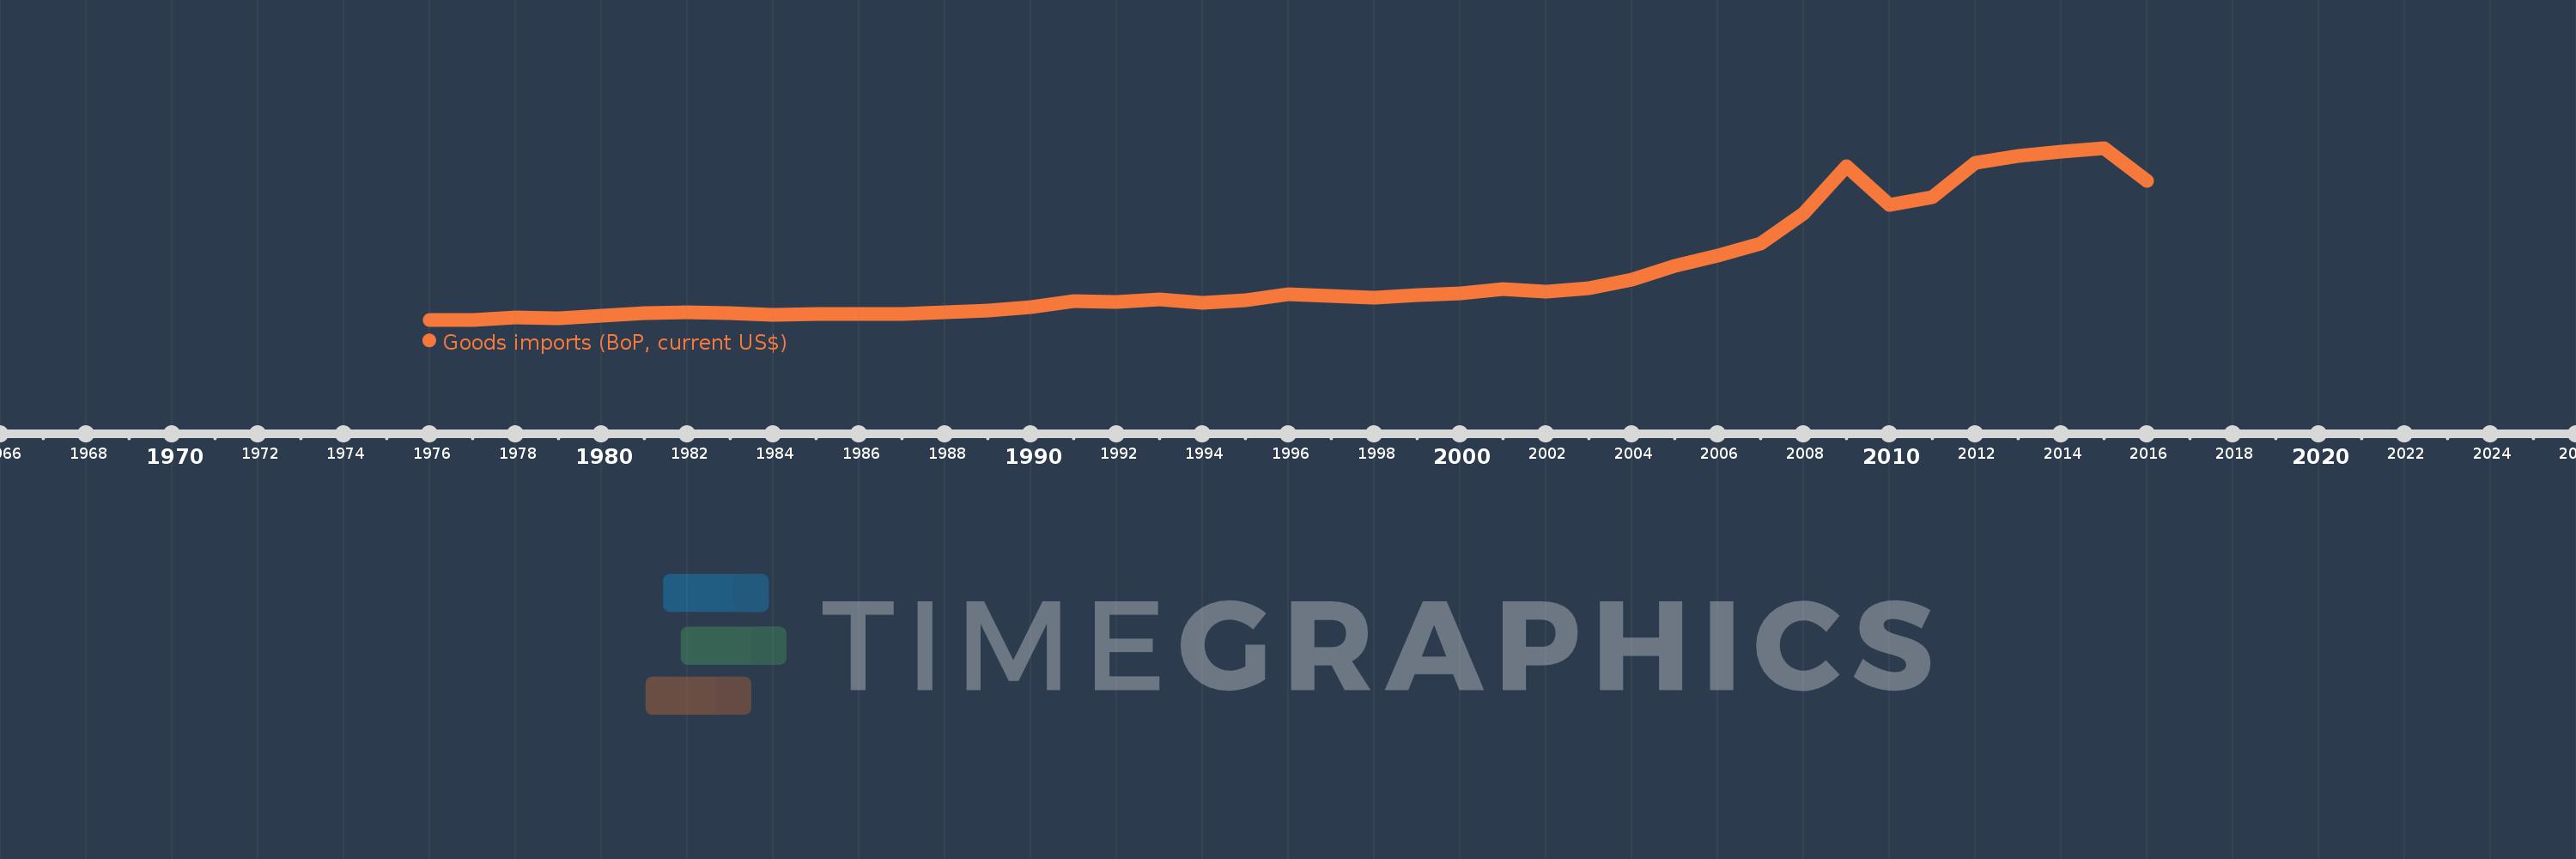
Goods imports (BoP, current US$)
2016,2015,2014,2013,2012,2011,2010,2009,2008,2007,2006,2005,2004,2003,2002,2001,2000,1999,1998,1997,1996,1995,1994,1993,1992,1991,1990,1989,1988,1987,1986,1985,1984,1983,1982,1981,1980,1979,1978,1977,1976
This statistics in other country:
AfghanistanAlbaniaAlgeriaAngolaAntigua and BarbudaArab WorldArgentinaArmeniaArubaAustraliaAustriaAzerbaijanBahamas, TheBahrainBangladeshBarbadosBelarusBelgiumBelizeBeninBermudaBhutanBoliviaBosnia and HerzegovinaBotswanaBrazilBrunei DarussalamBulgariaBurkina FasoBurundiCabo VerdeCambodiaCameroonCanadaCaribbean small statesCentral African RepublicCentral Europe and the BalticsChadChileChinaColombiaComorosCongo, Dem. Rep.Congo, Rep.Costa RicaCote d'IvoireCroatiaCuracaoCyprusCzech RepublicDenmarkDjiboutiDominicaDominican RepublicEarly-demographic dividendEast Asia & PacificEast Asia & Pacific (excluding high income)East Asia & Pacific (IDA & IBRD countries)EcuadorEgypt, Arab Rep.El SalvadorEquatorial GuineaEritreaEstoniaEthiopiaEuro areaEurope & Central AsiaEurope & Central Asia (excluding high income)Europe & Central Asia (IDA & IBRD countries)European UnionFaroe IslandsFijiFinlandFragile and conflict affected situationsFranceFrench PolynesiaGabonGambia, TheGeorgiaGermanyGhanaGreeceGrenadaGuatemalaGuineaGuinea-BissauGuyanaHaitiHeavily indebted poor countries (HIPC)High incomeHondurasHong Kong SAR, ChinaHungaryIBRD onlyIcelandIDA & IBRD totalIDA blendIDA onlyIDA totalIndiaIndonesiaIran, Islamic Rep.IraqIrelandIsraelItalyJamaicaJapanJordanKazakhstanKenyaKiribatiKorea, Rep.KosovoKuwaitKyrgyz RepublicLao PDRLate-demographic dividendLatin America & Caribbean Latin America & Caribbean (excluding high income)Latin America & the Caribbean (IDA & IBRD countries)LatviaLeast developed countries: UN classificationLebanonLesothoLiberiaLibyaLithuaniaLow & middle incomeLow incomeLower middle incomeLuxembourgMacao SAR, ChinaMacedonia, FYRMadagascarMalawiMalaysiaMaldivesMaliMaltaMarshall IslandsMauritaniaMauritiusMexicoMicronesia, Fed. Sts.Middle East & North Africa (excluding high income)Middle East & North Africa (IDA & IBRD countries)Middle incomeMoldovaMongoliaMontenegroMoroccoMozambiqueMyanmarNamibiaNepalNetherlandsNew CaledoniaNew ZealandNicaraguaNigerNigeriaNorth AmericaNorwayOECD membersOmanOther small statesPacific island small statesPakistanPalauPanamaPapua New GuineaParaguayPeruPhilippinesPolandPortugalPost-demographic dividendPre-demographic dividendQatarRomaniaRussian FederationRwandaSamoaSao Tome and PrincipeSaudi ArabiaSenegalSerbiaSeychellesSierra LeoneSingaporeSint Maarten (Dutch part)Slovak RepublicSloveniaSmall statesSolomon IslandsSouth AfricaSouth AsiaSouth Asia (IDA & IBRD)South SudanSpainSri LankaSt. Kitts and NevisSt. LuciaSt. Vincent and the GrenadinesSub-Saharan Africa Sub-Saharan Africa (excluding high income)Sub-Saharan Africa (IDA & IBRD countries)SudanSurinameSwazilandSwedenSwitzerlandSyrian Arab RepublicTajikistanTanzaniaThailandTimor-LesteTogoTongaTrinidad and TobagoTunisiaTurkeyTuvaluUgandaUkraineUnited KingdomUnited StatesUpper middle incomeUruguayVanuatuVenezuela, RBVietnamWest Bank and GazaWorldYemen, Rep.ZambiaZimbabwe Timeline:
This timeline shows a graph from 1976 to 2016 of Morocco. No data until 1975. Number of actual observations by date: 41.
Source name:
World Development Indicators
Source organization:
International Monetary Fund, Balance of Payments Statistics Yearbook and data files.
Categories, topics:
Economy & Growth, Trade
Last updated:
apr 23, 2017
Indicators value changes by year
Minimum:
2.252 bln
jan 1, 1976
Maximum:
40.683 bln
jan 1, 2015
At the date of observation
Value
Absolute change
Change from previous value
jan 1, 1976
2.252 bln
+2.252 bln
0.0%
jan 1, 1977
2.287 bln
+35.53 mln
1.58%
jan 1, 1978
2.8 bln
+512.463 mln
22.41%
jan 1, 1979
2.614 bln
-185.379 mln
-6.62%
jan 1, 1980
3.244 bln
+629.48 mln
24.08%
jan 1, 1981
3.771 bln
+527.18 mln
16.25%
jan 1, 1982
3.84 bln
+69.484 mln
1.84%
jan 1, 1983
3.816 bln
-24.105 mln
-0.63%
jan 1, 1984
3.302 bln
-514.299 mln
-13.48%
jan 1, 1985
3.571 bln
+268.667 mln
8.14%
jan 1, 1986
3.515 bln
-55.692 mln
-1.56%
jan 1, 1987
3.481 bln
-34.205 mln
-0.97%
jan 1, 1988
3.864 bln
+383.645 mln
11.02%
jan 1, 1989
4.384 bln
+519.05 mln
13.43%
jan 1, 1990
5.027 bln
+643.944 mln
14.69%
jan 1, 1991
6.338 bln
+1.31 bln
26.06%
jan 1, 1992
6.264 bln
-73.959 mln
-1.17%
jan 1, 1993
6.716 bln
+452.045 mln
7.22%
jan 1, 1994
6.082 bln
-633.363 mln
-9.43%
jan 1, 1995
6.551 bln
+468.325 mln
7.7%
jan 1, 1996
7.875 bln
+1.324 bln
20.22%
jan 1, 1997
7.628 bln
-246.463 mln
-3.13%
jan 1, 1998
7.256 bln
-372.451 mln
-4.88%
jan 1, 1999
7.772 bln
+516.33 mln
7.12%
jan 1, 2000
8.15 bln
+377.842 mln
4.86%
jan 1, 2001
9.052 bln
+901.725 mln
11.06%
jan 1, 2002
8.541 bln
-511.233 mln
-5.65%
jan 1, 2003
9.224 bln
+683.611 mln
8.0%
jan 1, 2004
11.201 bln
+1.977 bln
21.43%
jan 1, 2005
14.275 bln
+3.074 bln
27.44%
jan 1, 2006
16.698 bln
+2.423 bln
16.98%
jan 1, 2007
19.383 bln
+2.685 bln
16.08%
jan 1, 2008
25.954 bln
+6.571 bln
33.9%
jan 1, 2009
36.651 bln
+10.697 bln
41.21%
jan 1, 2010
28.027 bln
-8.623 bln
-23.53%
jan 1, 2011
29.627 bln
+1.6 bln
5.71%
jan 1, 2012
37.333 bln
+7.706 bln
26.01%
jan 1, 2013
38.877 bln
+1.544 bln
4.14%
jan 1, 2014
39.854 bln
+976.632 mln
2.51%
jan 1, 2015
40.683 bln
+829.096 mln
2.08%
jan 1, 2016
33.307 bln
-7.376 bln
-18.13%
Ranking of countries by current statistics by years


Comments: