29
/
en
AIzaSyAYiBZKx7MnpbEhh9jyipgxe19OcubqV5w
April 1, 2024
206785
Nepal
NPL
true
2
1
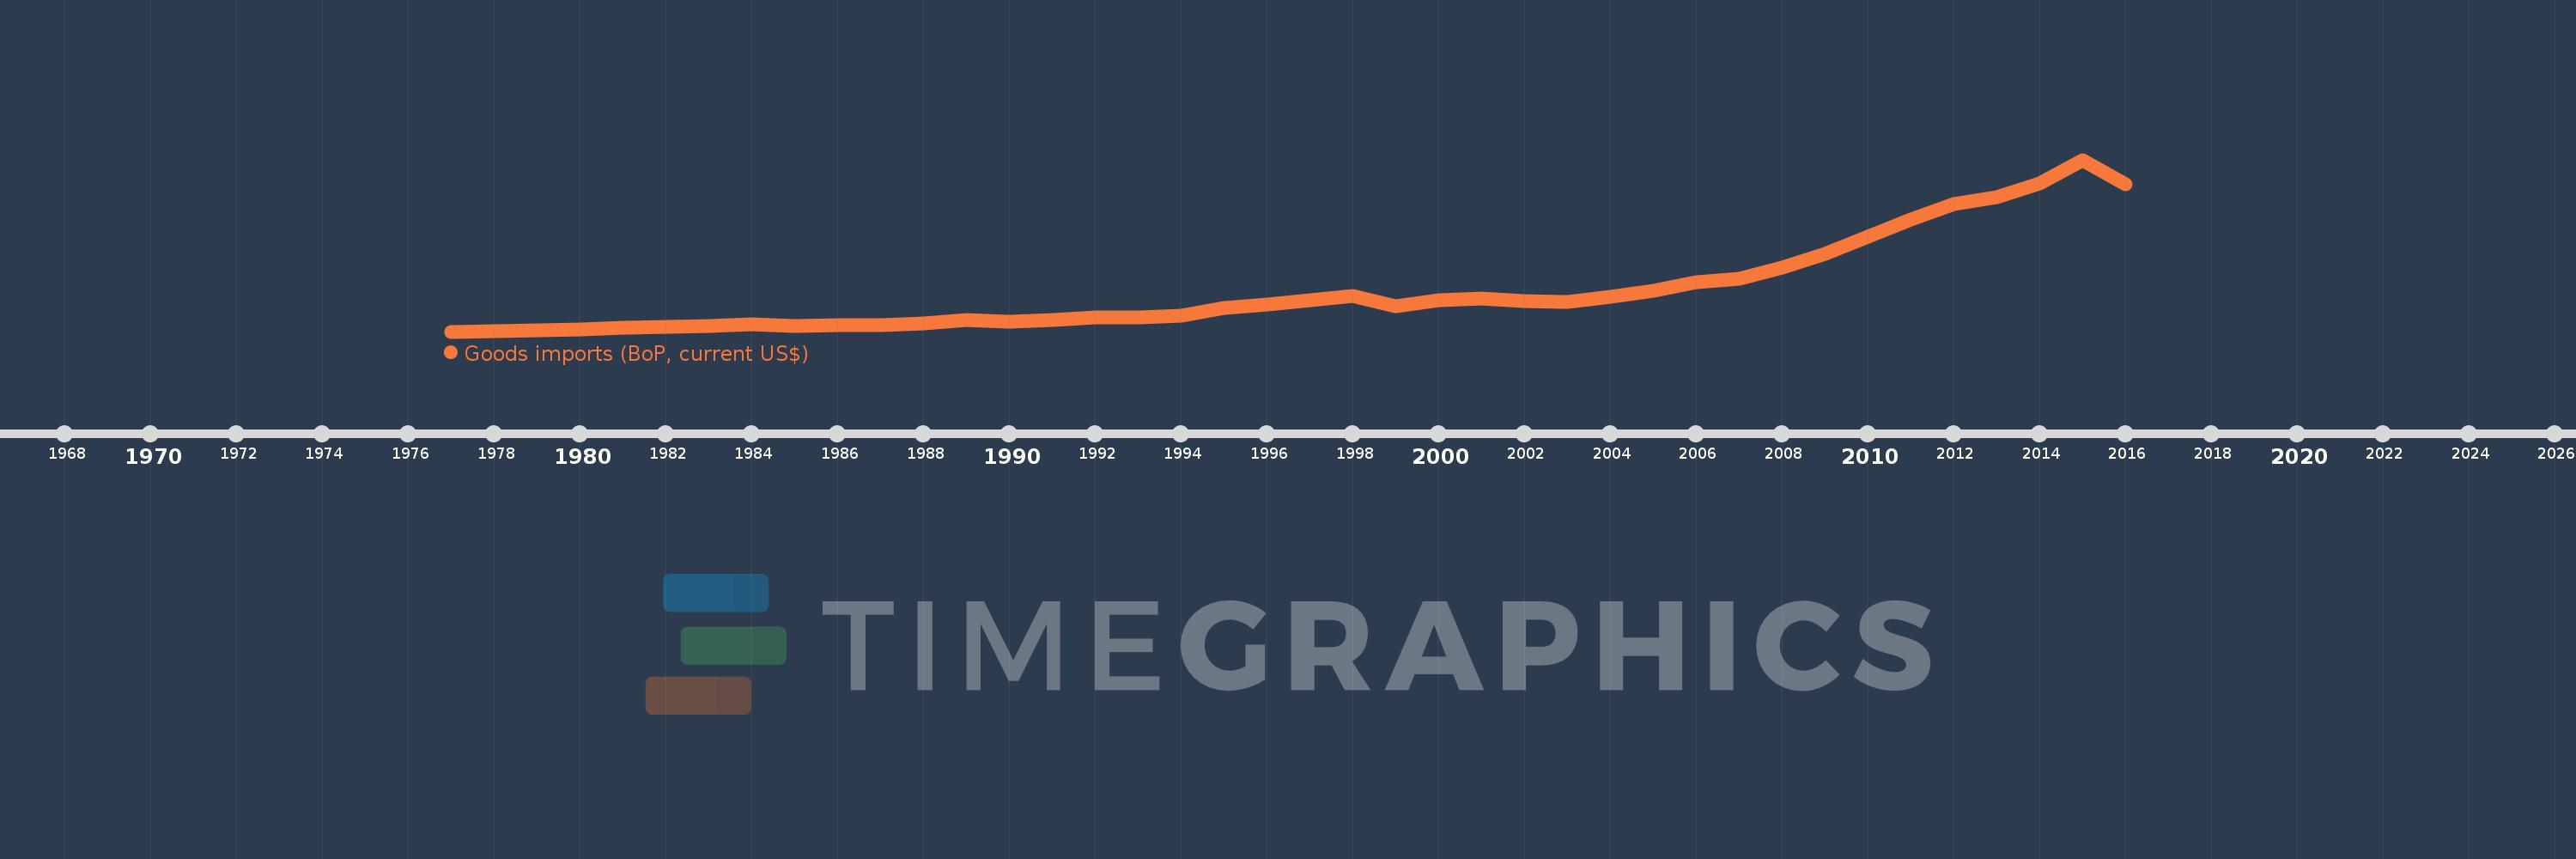
Goods imports (BoP, current US$)
2016,2015,2014,2013,2012,2011,2010,2009,2008,2007,2006,2005,2004,2003,2002,2001,2000,1999,1998,1997,1996,1995,1994,1993,1992,1991,1990,1989,1988,1987,1986,1985,1984,1983,1982,1981,1980,1979,1978,1977
This statistics in other country:
AfghanistanAlbaniaAlgeriaAngolaAntigua and BarbudaArab WorldArgentinaArmeniaArubaAustraliaAustriaAzerbaijanBahamas, TheBahrainBangladeshBarbadosBelarusBelgiumBelizeBeninBermudaBhutanBoliviaBosnia and HerzegovinaBotswanaBrazilBrunei DarussalamBulgariaBurkina FasoBurundiCabo VerdeCambodiaCameroonCanadaCaribbean small statesCentral African RepublicCentral Europe and the BalticsChadChileChinaColombiaComorosCongo, Dem. Rep.Congo, Rep.Costa RicaCote d'IvoireCroatiaCuracaoCyprusCzech RepublicDenmarkDjiboutiDominicaDominican RepublicEarly-demographic dividendEast Asia & PacificEast Asia & Pacific (excluding high income)East Asia & Pacific (IDA & IBRD countries)EcuadorEgypt, Arab Rep.El SalvadorEquatorial GuineaEritreaEstoniaEthiopiaEuro areaEurope & Central AsiaEurope & Central Asia (excluding high income)Europe & Central Asia (IDA & IBRD countries)European UnionFaroe IslandsFijiFinlandFragile and conflict affected situationsFranceFrench PolynesiaGabonGambia, TheGeorgiaGermanyGhanaGreeceGrenadaGuatemalaGuineaGuinea-BissauGuyanaHaitiHeavily indebted poor countries (HIPC)High incomeHondurasHong Kong SAR, ChinaHungaryIBRD onlyIcelandIDA & IBRD totalIDA blendIDA onlyIDA totalIndiaIndonesiaIran, Islamic Rep.IraqIrelandIsraelItalyJamaicaJapanJordanKazakhstanKenyaKiribatiKorea, Rep.KosovoKuwaitKyrgyz RepublicLao PDRLate-demographic dividendLatin America & Caribbean Latin America & Caribbean (excluding high income)Latin America & the Caribbean (IDA & IBRD countries)LatviaLeast developed countries: UN classificationLebanonLesothoLiberiaLibyaLithuaniaLow & middle incomeLow incomeLower middle incomeLuxembourgMacao SAR, ChinaMacedonia, FYRMadagascarMalawiMalaysiaMaldivesMaliMaltaMarshall IslandsMauritaniaMauritiusMexicoMicronesia, Fed. Sts.Middle East & North Africa (excluding high income)Middle East & North Africa (IDA & IBRD countries)Middle incomeMoldovaMongoliaMontenegroMoroccoMozambiqueMyanmarNamibiaNepalNetherlandsNew CaledoniaNew ZealandNicaraguaNigerNigeriaNorth AmericaNorwayOECD membersOmanOther small statesPacific island small statesPakistanPalauPanamaPapua New GuineaParaguayPeruPhilippinesPolandPortugalPost-demographic dividendPre-demographic dividendQatarRomaniaRussian FederationRwandaSamoaSao Tome and PrincipeSaudi ArabiaSenegalSerbiaSeychellesSierra LeoneSingaporeSint Maarten (Dutch part)Slovak RepublicSloveniaSmall statesSolomon IslandsSouth AfricaSouth AsiaSouth Asia (IDA & IBRD)South SudanSpainSri LankaSt. Kitts and NevisSt. LuciaSt. Vincent and the GrenadinesSub-Saharan Africa Sub-Saharan Africa (excluding high income)Sub-Saharan Africa (IDA & IBRD countries)SudanSurinameSwazilandSwedenSwitzerlandSyrian Arab RepublicTajikistanTanzaniaThailandTimor-LesteTogoTongaTrinidad and TobagoTunisiaTurkeyTuvaluUgandaUkraineUnited KingdomUnited StatesUpper middle incomeUruguayVanuatuVenezuela, RBVietnamWest Bank and GazaWorldYemen, Rep.ZambiaZimbabwe Timeline:
This timeline shows a graph from 1977 to 2016 of Nepal. No data until 1976. Number of actual observations by date: 40.
Source name:
World Development Indicators
Source organization:
International Monetary Fund, Balance of Payments Statistics Yearbook and data files.
Categories, topics:
Economy & Growth, Trade
Last updated:
apr 23, 2017
Indicators value changes by year
Minimum:
154.106 mln
jan 1, 1977
Maximum:
7.58 bln
jan 1, 2015
At the date of observation
Value
Absolute change
Change from previous value
jan 1, 1977
154.106 mln
+154.106 mln
0.0%
jan 1, 1978
165.702 mln
+11.596 mln
7.52%
jan 1, 1979
220.474 mln
+54.771 mln
33.05%
jan 1, 1980
251.378 mln
+30.904 mln
14.02%
jan 1, 1981
327.951 mln
+76.573 mln
30.46%
jan 1, 1982
362.366 mln
+34.415 mln
10.49%
jan 1, 1983
406.338 mln
+43.972 mln
12.13%
jan 1, 1984
468.26 mln
+61.923 mln
15.24%
jan 1, 1985
402.901 mln
-65.36 mln
-13.96%
jan 1, 1986
444.035 mln
+41.134 mln
10.21%
jan 1, 1987
436.481 mln
-7.553 mln
-1.7%
jan 1, 1988
512.363 mln
+75.882 mln
17.38%
jan 1, 1989
664.86 mln
+152.497 mln
29.76%
jan 1, 1990
568.129 mln
-96.732 mln
-14.55%
jan 1, 1991
666.593 mln
+98.464 mln
17.33%
jan 1, 1992
756.876 mln
+90.283 mln
13.54%
jan 1, 1993
752.056 mln
-4.82 mln
-0.64%
jan 1, 1994
858.592 mln
+106.536 mln
14.17%
jan 1, 1995
1.159 bln
+300.345 mln
34.98%
jan 1, 1996
1.311 bln
+151.897 mln
13.11%
jan 1, 1997
1.495 bln
+183.844 mln
14.02%
jan 1, 1998
1.692 bln
+197.194 mln
13.19%
jan 1, 1999
1.239 bln
-452.769 mln
-26.76%
jan 1, 2000
1.494 bln
+255.067 mln
20.58%
jan 1, 2001
1.59 bln
+95.938 mln
6.42%
jan 1, 2002
1.486 bln
-104.384 mln
-6.56%
jan 1, 2003
1.425 bln
-60.327 mln
-4.06%
jan 1, 2004
1.666 bln
+240.536 mln
16.88%
jan 1, 2005
1.908 bln
+242.067 mln
14.53%
jan 1, 2006
2.276 bln
+368.46 mln
19.31%
jan 1, 2007
2.441 bln
+164.563 mln
7.23%
jan 1, 2008
2.933 bln
+491.55 mln
20.14%
jan 1, 2009
3.519 bln
+586.769 mln
20.01%
jan 1, 2010
4.259 bln
+740.012 mln
21.03%
jan 1, 2011
5.009 bln
+749.834 mln
17.6%
jan 1, 2012
5.665 bln
+655.892 mln
13.09%
jan 1, 2013
5.951 bln
+286.078 mln
5.05%
jan 1, 2014
6.543 bln
+591.801 mln
9.94%
jan 1, 2015
7.58 bln
+1.038 bln
15.86%
jan 1, 2016
6.511 bln
-1.07 bln
-14.11%
Ranking of countries by current statistics by years


Comments: