29
/
en
AIzaSyAYiBZKx7MnpbEhh9jyipgxe19OcubqV5w
April 1, 2024
69845
Argentina
ARG
true
2
1
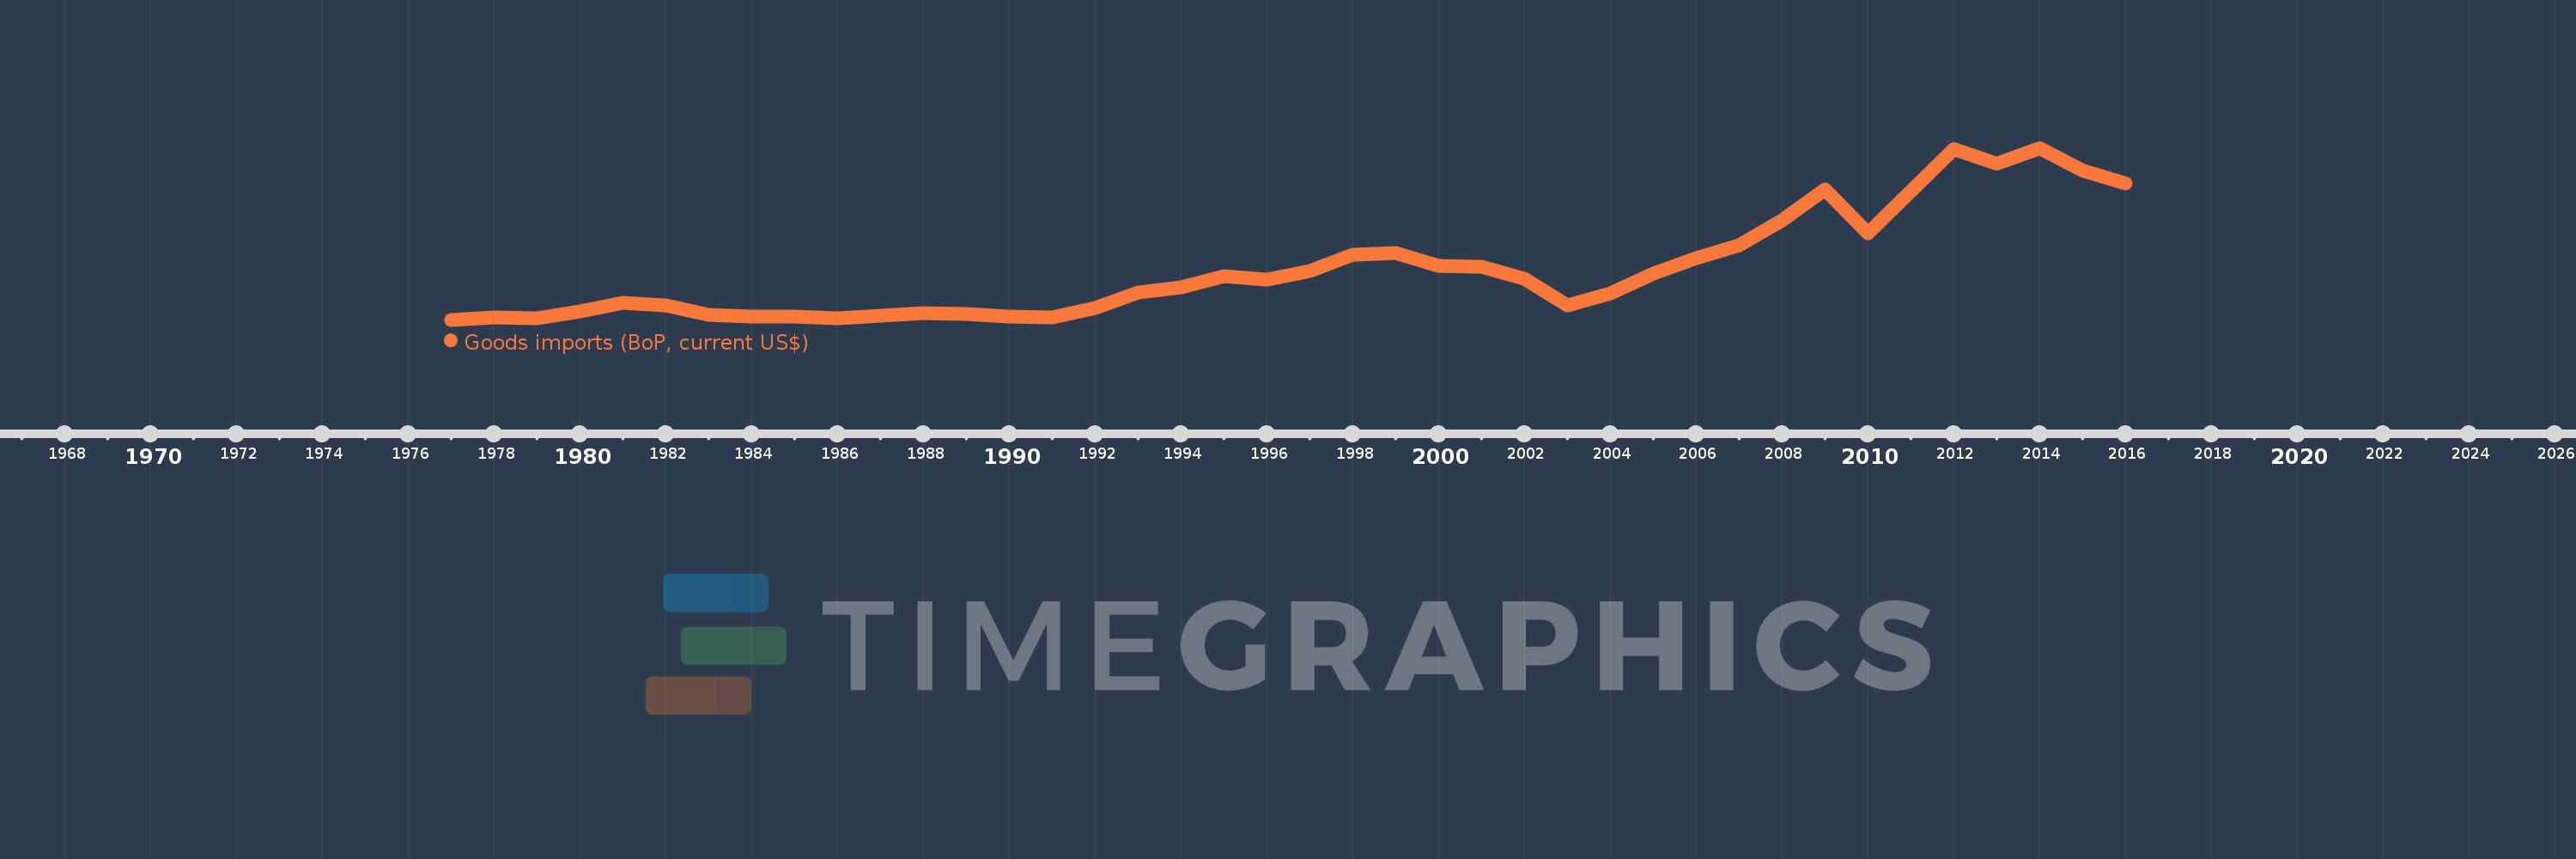
Goods imports (BoP, current US$)
2016,2015,2014,2013,2012,2011,2010,2009,2008,2007,2006,2005,2004,2003,2002,2001,2000,1999,1998,1997,1996,1995,1994,1993,1992,1991,1990,1989,1988,1987,1986,1985,1984,1983,1982,1981,1980,1979,1978,1977
This statistics in other country:
AfghanistanAlbaniaAlgeriaAngolaAntigua and BarbudaArab WorldArgentinaArmeniaArubaAustraliaAustriaAzerbaijanBahamas, TheBahrainBangladeshBarbadosBelarusBelgiumBelizeBeninBermudaBhutanBoliviaBosnia and HerzegovinaBotswanaBrazilBrunei DarussalamBulgariaBurkina FasoBurundiCabo VerdeCambodiaCameroonCanadaCaribbean small statesCentral African RepublicCentral Europe and the BalticsChadChileChinaColombiaComorosCongo, Dem. Rep.Congo, Rep.Costa RicaCote d'IvoireCroatiaCuracaoCyprusCzech RepublicDenmarkDjiboutiDominicaDominican RepublicEarly-demographic dividendEast Asia & PacificEast Asia & Pacific (excluding high income)East Asia & Pacific (IDA & IBRD countries)EcuadorEgypt, Arab Rep.El SalvadorEquatorial GuineaEritreaEstoniaEthiopiaEuro areaEurope & Central AsiaEurope & Central Asia (excluding high income)Europe & Central Asia (IDA & IBRD countries)European UnionFaroe IslandsFijiFinlandFragile and conflict affected situationsFranceFrench PolynesiaGabonGambia, TheGeorgiaGermanyGhanaGreeceGrenadaGuatemalaGuineaGuinea-BissauGuyanaHaitiHeavily indebted poor countries (HIPC)High incomeHondurasHong Kong SAR, ChinaHungaryIBRD onlyIcelandIDA & IBRD totalIDA blendIDA onlyIDA totalIndiaIndonesiaIran, Islamic Rep.IraqIrelandIsraelItalyJamaicaJapanJordanKazakhstanKenyaKiribatiKorea, Rep.KosovoKuwaitKyrgyz RepublicLao PDRLate-demographic dividendLatin America & Caribbean Latin America & Caribbean (excluding high income)Latin America & the Caribbean (IDA & IBRD countries)LatviaLeast developed countries: UN classificationLebanonLesothoLiberiaLibyaLithuaniaLow & middle incomeLow incomeLower middle incomeLuxembourgMacao SAR, ChinaMacedonia, FYRMadagascarMalawiMalaysiaMaldivesMaliMaltaMarshall IslandsMauritaniaMauritiusMexicoMicronesia, Fed. Sts.Middle East & North Africa (excluding high income)Middle East & North Africa (IDA & IBRD countries)Middle incomeMoldovaMongoliaMontenegroMoroccoMozambiqueMyanmarNamibiaNepalNetherlandsNew CaledoniaNew ZealandNicaraguaNigerNigeriaNorth AmericaNorwayOECD membersOmanOther small statesPacific island small statesPakistanPalauPanamaPapua New GuineaParaguayPeruPhilippinesPolandPortugalPost-demographic dividendPre-demographic dividendQatarRomaniaRussian FederationRwandaSamoaSao Tome and PrincipeSaudi ArabiaSenegalSerbiaSeychellesSierra LeoneSingaporeSint Maarten (Dutch part)Slovak RepublicSloveniaSmall statesSolomon IslandsSouth AfricaSouth AsiaSouth Asia (IDA & IBRD)South SudanSpainSri LankaSt. Kitts and NevisSt. LuciaSt. Vincent and the GrenadinesSub-Saharan Africa Sub-Saharan Africa (excluding high income)Sub-Saharan Africa (IDA & IBRD countries)SudanSurinameSwazilandSwedenSwitzerlandSyrian Arab RepublicTajikistanTanzaniaThailandTimor-LesteTogoTongaTrinidad and TobagoTunisiaTurkeyTuvaluUgandaUkraineUnited KingdomUnited StatesUpper middle incomeUruguayVanuatuVenezuela, RBVietnamWest Bank and GazaWorldYemen, Rep.ZambiaZimbabwe Timeline:
This timeline shows a graph from 1977 to 2016 of Argentina. No data until 1976. Number of actual observations by date: 40.
Source name:
World Development Indicators
Source organization:
International Monetary Fund, Balance of Payments Statistics Yearbook and data files.
Categories, topics:
Economy & Growth, Trade
Last updated:
apr 23, 2017
Indicators value changes by year
Minimum:
2.765 bln
jan 1, 1977
Maximum:
71.293 bln
jan 1, 2014
At the date of observation
Value
Absolute change
Change from previous value
jan 1, 1977
2.765 bln
+2.765 bln
0.0%
jan 1, 1978
3.799 bln
+1.034 bln
37.4%
jan 1, 1979
3.488 bln
-311.0 mln
-8.19%
jan 1, 1980
6.028 bln
+2.54 bln
72.82%
jan 1, 1981
9.394 bln
+3.366 bln
55.84%
jan 1, 1982
8.431 bln
-963.0 mln
-10.25%
jan 1, 1983
4.859 bln
-3.572 bln
-42.37%
jan 1, 1984
4.119 bln
-740.0 mln
-15.23%
jan 1, 1985
4.118 bln
-1000.0K
-0.02%
jan 1, 1986
3.518 bln
-600.0 mln
-14.57%
jan 1, 1987
4.406 bln
+888.0 mln
25.24%
jan 1, 1988
5.343 bln
+937.0 mln
21.27%
jan 1, 1989
4.892 bln
-451.0 mln
-8.44%
jan 1, 1990
3.864 bln
-1.028 bln
-21.01%
jan 1, 1991
3.726 bln
-138.0 mln
-3.57%
jan 1, 1992
7.559 bln
+3.833 bln
102.87%
jan 1, 1993
13.795 bln
+6.236 bln
82.5%
jan 1, 1994
15.633 bln
+1.838 bln
13.32%
jan 1, 1995
20.162 bln
+4.53 bln
28.98%
jan 1, 1996
18.804 bln
-1.358 bln
-6.73%
jan 1, 1997
22.283 bln
+3.479 bln
18.5%
jan 1, 1998
28.553 bln
+6.27 bln
28.14%
jan 1, 1999
29.531 bln
+977.4 mln
3.42%
jan 1, 2000
24.103 bln
-5.428 bln
-18.38%
jan 1, 2001
23.889 bln
-214.1 mln
-0.89%
jan 1, 2002
19.158 bln
-4.731 bln
-19.81%
jan 1, 2003
8.473 bln
-10.685 bln
-55.77%
jan 1, 2004
13.134 bln
+4.661 bln
55.01%
jan 1, 2005
21.311 bln
+8.177 bln
62.26%
jan 1, 2006
27.3 bln
+5.989 bln
28.1%
jan 1, 2007
32.588 bln
+5.288 bln
19.37%
jan 1, 2008
42.525 bln
+9.937 bln
30.49%
jan 1, 2009
54.596 bln
+12.072 bln
28.39%
jan 1, 2010
37.146 bln
-17.45 bln
-31.96%
jan 1, 2011
54.159 bln
+17.013 bln
45.8%
jan 1, 2012
70.769 bln
+16.61 bln
30.67%
jan 1, 2013
65.043 bln
-5.726 bln
-8.09%
jan 1, 2014
71.293 bln
+6.25 bln
9.61%
jan 1, 2015
62.429 bln
-8.864 bln
-12.43%
jan 1, 2016
57.176 bln
-5.253 bln
-8.41%
Ranking of countries by current statistics by years


Comments: