29
/
en
AIzaSyAYiBZKx7MnpbEhh9jyipgxe19OcubqV5w
April 1, 2024
214345
Norway
NOR
true
2
1
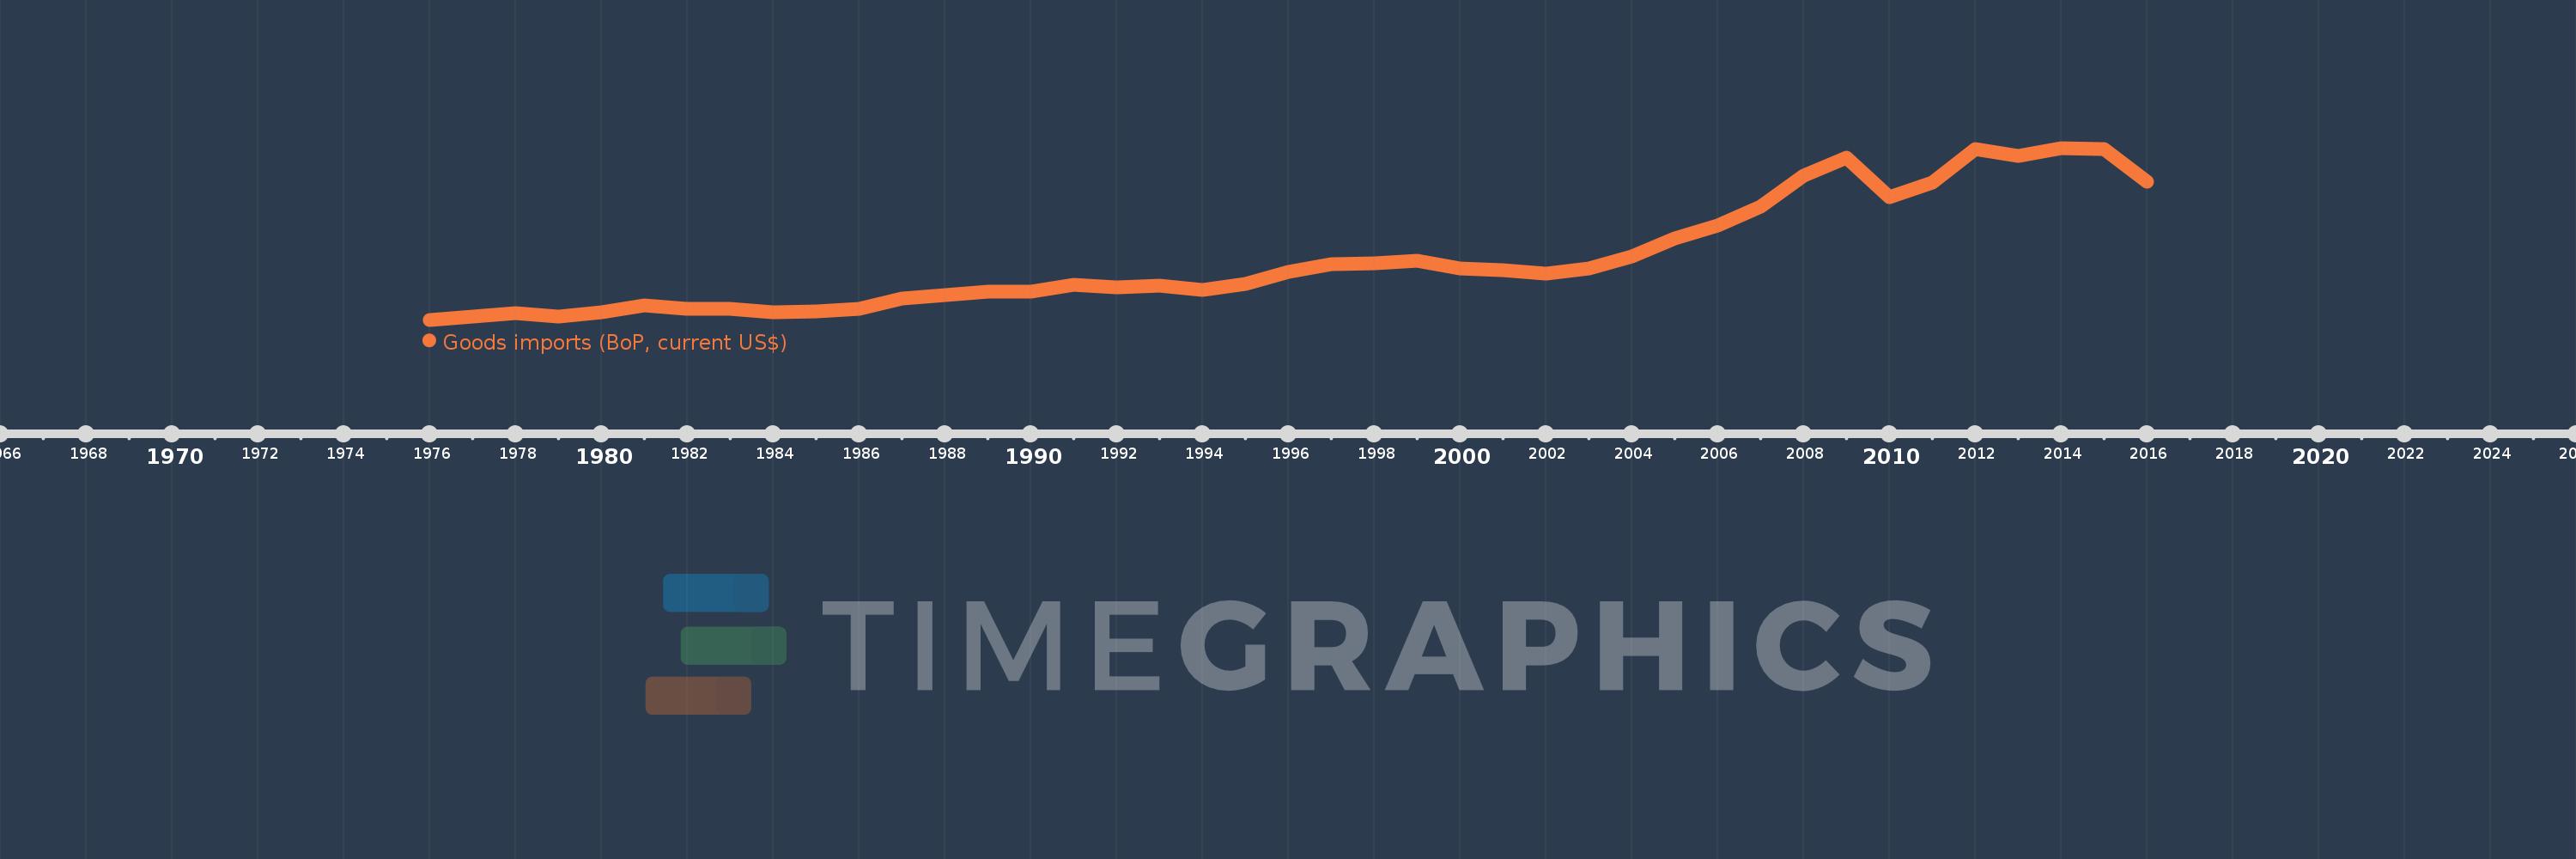
Goods imports (BoP, current US$)
2016,2015,2014,2013,2012,2011,2010,2009,2008,2007,2006,2005,2004,2003,2002,2001,2000,1999,1998,1997,1996,1995,1994,1993,1992,1991,1990,1989,1988,1987,1986,1985,1984,1983,1982,1981,1980,1979,1978,1977,1976
This statistics in other country:
AfghanistanAlbaniaAlgeriaAngolaAntigua and BarbudaArab WorldArgentinaArmeniaArubaAustraliaAustriaAzerbaijanBahamas, TheBahrainBangladeshBarbadosBelarusBelgiumBelizeBeninBermudaBhutanBoliviaBosnia and HerzegovinaBotswanaBrazilBrunei DarussalamBulgariaBurkina FasoBurundiCabo VerdeCambodiaCameroonCanadaCaribbean small statesCentral African RepublicCentral Europe and the BalticsChadChileChinaColombiaComorosCongo, Dem. Rep.Congo, Rep.Costa RicaCote d'IvoireCroatiaCuracaoCyprusCzech RepublicDenmarkDjiboutiDominicaDominican RepublicEarly-demographic dividendEast Asia & PacificEast Asia & Pacific (excluding high income)East Asia & Pacific (IDA & IBRD countries)EcuadorEgypt, Arab Rep.El SalvadorEquatorial GuineaEritreaEstoniaEthiopiaEuro areaEurope & Central AsiaEurope & Central Asia (excluding high income)Europe & Central Asia (IDA & IBRD countries)European UnionFaroe IslandsFijiFinlandFragile and conflict affected situationsFranceFrench PolynesiaGabonGambia, TheGeorgiaGermanyGhanaGreeceGrenadaGuatemalaGuineaGuinea-BissauGuyanaHaitiHeavily indebted poor countries (HIPC)High incomeHondurasHong Kong SAR, ChinaHungaryIBRD onlyIcelandIDA & IBRD totalIDA blendIDA onlyIDA totalIndiaIndonesiaIran, Islamic Rep.IraqIrelandIsraelItalyJamaicaJapanJordanKazakhstanKenyaKiribatiKorea, Rep.KosovoKuwaitKyrgyz RepublicLao PDRLate-demographic dividendLatin America & Caribbean Latin America & Caribbean (excluding high income)Latin America & the Caribbean (IDA & IBRD countries)LatviaLeast developed countries: UN classificationLebanonLesothoLiberiaLibyaLithuaniaLow & middle incomeLow incomeLower middle incomeLuxembourgMacao SAR, ChinaMacedonia, FYRMadagascarMalawiMalaysiaMaldivesMaliMaltaMarshall IslandsMauritaniaMauritiusMexicoMicronesia, Fed. Sts.Middle East & North Africa (excluding high income)Middle East & North Africa (IDA & IBRD countries)Middle incomeMoldovaMongoliaMontenegroMoroccoMozambiqueMyanmarNamibiaNepalNetherlandsNew CaledoniaNew ZealandNicaraguaNigerNigeriaNorth AmericaNorwayOECD membersOmanOther small statesPacific island small statesPakistanPalauPanamaPapua New GuineaParaguayPeruPhilippinesPolandPortugalPost-demographic dividendPre-demographic dividendQatarRomaniaRussian FederationRwandaSamoaSao Tome and PrincipeSaudi ArabiaSenegalSerbiaSeychellesSierra LeoneSingaporeSint Maarten (Dutch part)Slovak RepublicSloveniaSmall statesSolomon IslandsSouth AfricaSouth AsiaSouth Asia (IDA & IBRD)South SudanSpainSri LankaSt. Kitts and NevisSt. LuciaSt. Vincent and the GrenadinesSub-Saharan Africa Sub-Saharan Africa (excluding high income)Sub-Saharan Africa (IDA & IBRD countries)SudanSurinameSwazilandSwedenSwitzerlandSyrian Arab RepublicTajikistanTanzaniaThailandTimor-LesteTogoTongaTrinidad and TobagoTunisiaTurkeyTuvaluUgandaUkraineUnited KingdomUnited StatesUpper middle incomeUruguayVanuatuVenezuela, RBVietnamWest Bank and GazaWorldYemen, Rep.ZambiaZimbabwe Timeline:
This timeline shows a graph from 1976 to 2016 of Norway. No data until 1975. Number of actual observations by date: 41.
Source name:
World Development Indicators
Source organization:
International Monetary Fund, Balance of Payments Statistics Yearbook and data files.
Categories, topics:
Economy & Growth, Trade
Last updated:
apr 23, 2017
Indicators value changes by year
Minimum:
10.141 bln
jan 1, 1976
Maximum:
91.6 bln
jan 1, 2014
At the date of observation
Value
Absolute change
Change from previous value
jan 1, 1976
10.141 bln
+10.141 bln
0.0%
jan 1, 1977
11.608 bln
+1.466 bln
14.46%
jan 1, 1978
13.205 bln
+1.597 bln
13.76%
jan 1, 1979
11.545 bln
-1.66 bln
-12.57%
jan 1, 1980
13.601 bln
+2.055 bln
17.8%
jan 1, 1981
16.753 bln
+3.152 bln
23.18%
jan 1, 1982
15.454 bln
-1.298 bln
-7.75%
jan 1, 1983
15.291 bln
-163.256 mln
-1.06%
jan 1, 1984
13.705 bln
-1.586 bln
-10.37%
jan 1, 1985
13.952 bln
+247.156 mln
1.8%
jan 1, 1986
15.338 bln
+1.386 bln
9.93%
jan 1, 1987
20.238 bln
+4.901 bln
31.95%
jan 1, 1988
21.936 bln
+1.698 bln
8.39%
jan 1, 1989
23.28 bln
+1.344 bln
6.13%
jan 1, 1990
23.395 bln
+114.949 mln
0.49%
jan 1, 1991
26.548 bln
+3.153 bln
13.48%
jan 1, 1992
25.499 bln
-1.049 bln
-3.95%
jan 1, 1993
26.191 bln
+691.71 mln
2.71%
jan 1, 1994
24.43 bln
-1.761 bln
-6.72%
jan 1, 1995
26.98 bln
+2.55 bln
10.44%
jan 1, 1996
32.894 bln
+5.913 bln
21.92%
jan 1, 1997
36.338 bln
+3.444 bln
10.47%
jan 1, 1998
36.793 bln
+454.85 mln
1.25%
jan 1, 1999
37.958 bln
+1.165 bln
3.17%
jan 1, 2000
34.596 bln
-3.362 bln
-8.86%
jan 1, 2001
33.74 bln
-855.32 mln
-2.47%
jan 1, 2002
32.186 bln
-1.554 bln
-4.61%
jan 1, 2003
34.658 bln
+2.471 bln
7.68%
jan 1, 2004
39.992 bln
+5.334 bln
15.39%
jan 1, 2005
48.574 bln
+8.582 bln
21.46%
jan 1, 2006
54.743 bln
+6.169 bln
12.7%
jan 1, 2007
63.58 bln
+8.837 bln
16.14%
jan 1, 2008
78.372 bln
+14.792 bln
23.27%
jan 1, 2009
86.85 bln
+8.477 bln
10.82%
jan 1, 2010
68.126 bln
-18.724 bln
-21.56%
jan 1, 2011
75.038 bln
+6.913 bln
10.15%
jan 1, 2012
91.01 bln
+15.972 bln
21.29%
jan 1, 2013
87.799 bln
-3.211 bln
-3.53%
jan 1, 2014
91.6 bln
+3.801 bln
4.33%
jan 1, 2015
91.216 bln
-384.073 mln
-0.42%
jan 1, 2016
75.407 bln
-15.809 bln
-17.33%
Ranking of countries by current statistics by years


Comments: