29
/
en
AIzaSyAYiBZKx7MnpbEhh9jyipgxe19OcubqV5w
April 1, 2024
219610
Papua New Guinea
PNG
true
2
1
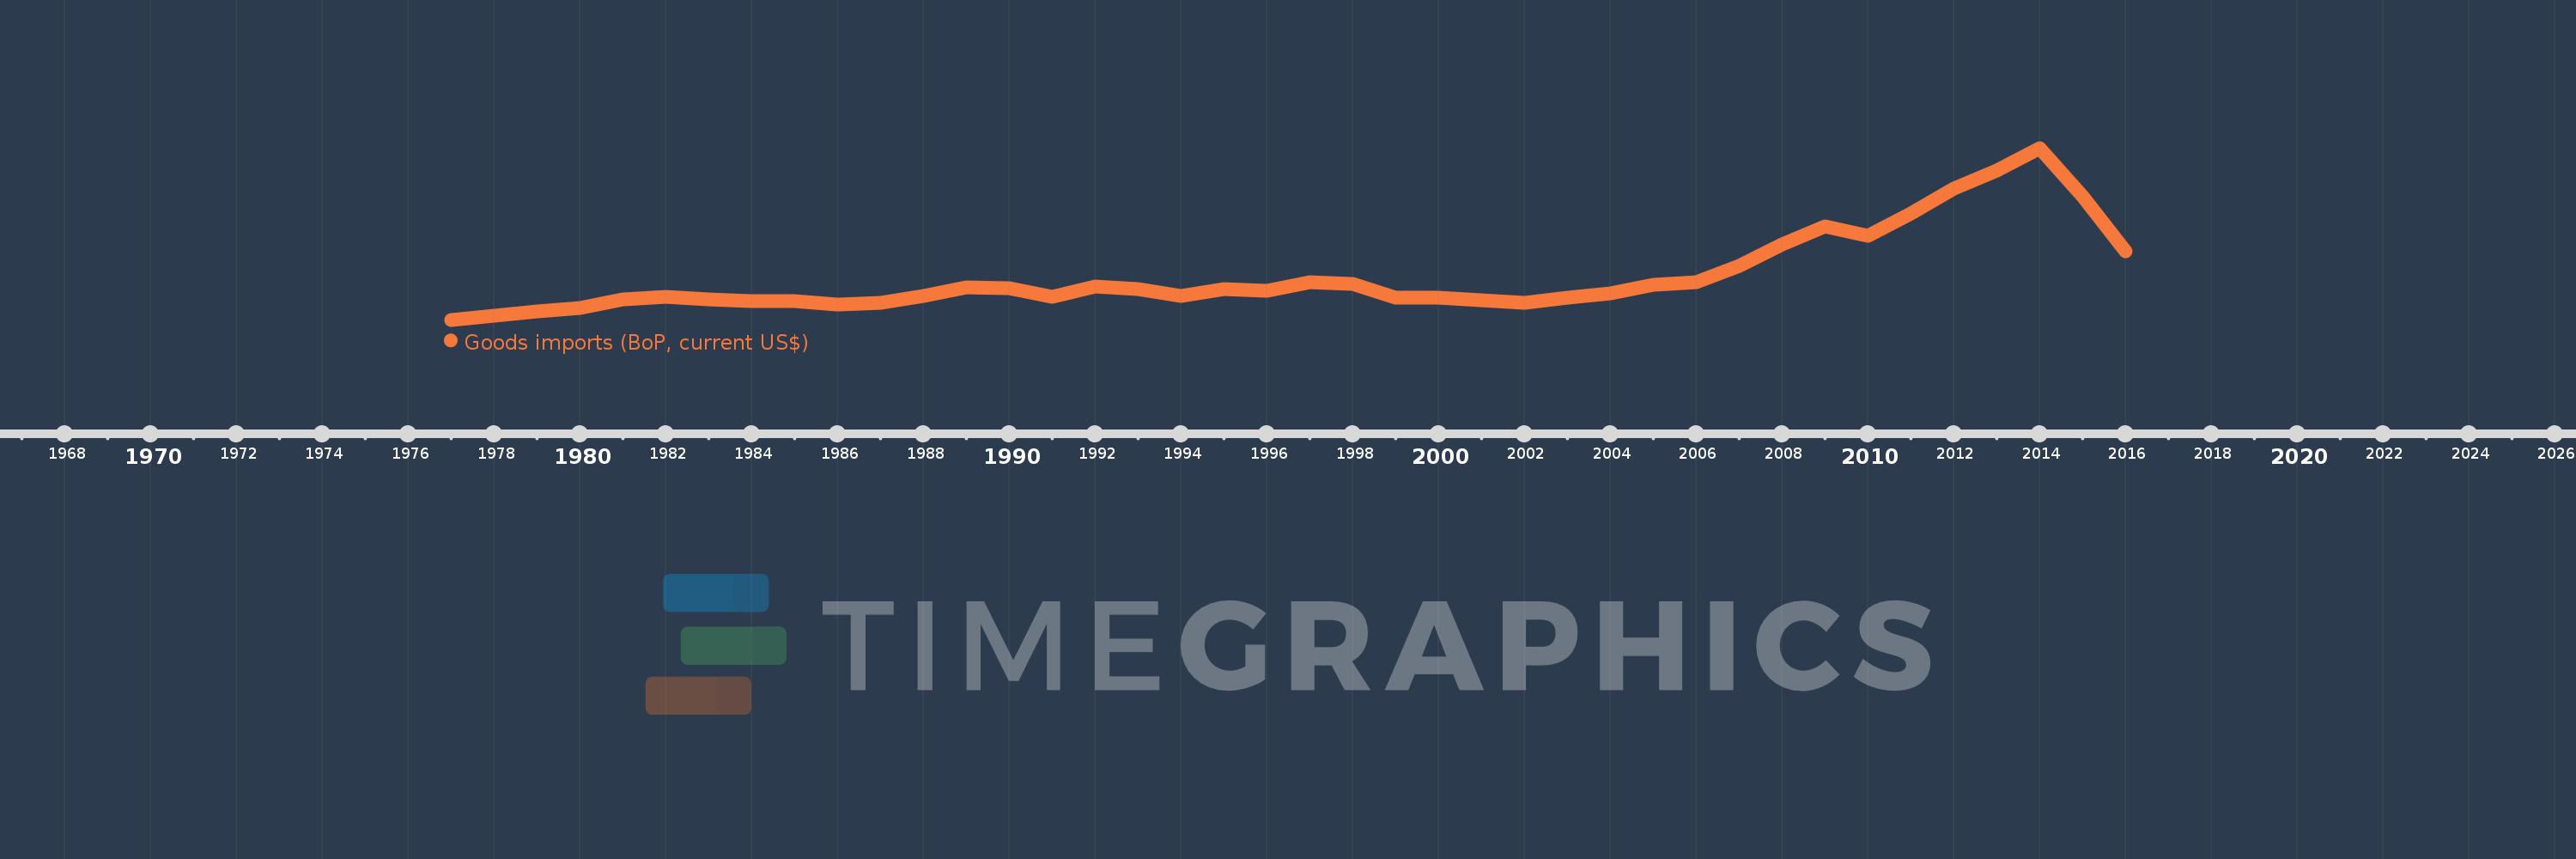
Goods imports (BoP, current US$)
2016,2015,2014,2013,2012,2011,2010,2009,2008,2007,2006,2005,2004,2003,2002,2001,2000,1999,1998,1997,1996,1995,1994,1993,1992,1991,1990,1989,1988,1987,1986,1985,1984,1983,1982,1981,1980,1979,1978,1977
This statistics in other country:
AfghanistanAlbaniaAlgeriaAngolaAntigua and BarbudaArab WorldArgentinaArmeniaArubaAustraliaAustriaAzerbaijanBahamas, TheBahrainBangladeshBarbadosBelarusBelgiumBelizeBeninBermudaBhutanBoliviaBosnia and HerzegovinaBotswanaBrazilBrunei DarussalamBulgariaBurkina FasoBurundiCabo VerdeCambodiaCameroonCanadaCaribbean small statesCentral African RepublicCentral Europe and the BalticsChadChileChinaColombiaComorosCongo, Dem. Rep.Congo, Rep.Costa RicaCote d'IvoireCroatiaCuracaoCyprusCzech RepublicDenmarkDjiboutiDominicaDominican RepublicEarly-demographic dividendEast Asia & PacificEast Asia & Pacific (excluding high income)East Asia & Pacific (IDA & IBRD countries)EcuadorEgypt, Arab Rep.El SalvadorEquatorial GuineaEritreaEstoniaEthiopiaEuro areaEurope & Central AsiaEurope & Central Asia (excluding high income)Europe & Central Asia (IDA & IBRD countries)European UnionFaroe IslandsFijiFinlandFragile and conflict affected situationsFranceFrench PolynesiaGabonGambia, TheGeorgiaGermanyGhanaGreeceGrenadaGuatemalaGuineaGuinea-BissauGuyanaHaitiHeavily indebted poor countries (HIPC)High incomeHondurasHong Kong SAR, ChinaHungaryIBRD onlyIcelandIDA & IBRD totalIDA blendIDA onlyIDA totalIndiaIndonesiaIran, Islamic Rep.IraqIrelandIsraelItalyJamaicaJapanJordanKazakhstanKenyaKiribatiKorea, Rep.KosovoKuwaitKyrgyz RepublicLao PDRLate-demographic dividendLatin America & Caribbean Latin America & Caribbean (excluding high income)Latin America & the Caribbean (IDA & IBRD countries)LatviaLeast developed countries: UN classificationLebanonLesothoLiberiaLibyaLithuaniaLow & middle incomeLow incomeLower middle incomeLuxembourgMacao SAR, ChinaMacedonia, FYRMadagascarMalawiMalaysiaMaldivesMaliMaltaMarshall IslandsMauritaniaMauritiusMexicoMicronesia, Fed. Sts.Middle East & North Africa (excluding high income)Middle East & North Africa (IDA & IBRD countries)Middle incomeMoldovaMongoliaMontenegroMoroccoMozambiqueMyanmarNamibiaNepalNetherlandsNew CaledoniaNew ZealandNicaraguaNigerNigeriaNorth AmericaNorwayOECD membersOmanOther small statesPacific island small statesPakistanPalauPanamaPapua New GuineaParaguayPeruPhilippinesPolandPortugalPost-demographic dividendPre-demographic dividendQatarRomaniaRussian FederationRwandaSamoaSao Tome and PrincipeSaudi ArabiaSenegalSerbiaSeychellesSierra LeoneSingaporeSint Maarten (Dutch part)Slovak RepublicSloveniaSmall statesSolomon IslandsSouth AfricaSouth AsiaSouth Asia (IDA & IBRD)South SudanSpainSri LankaSt. Kitts and NevisSt. LuciaSt. Vincent and the GrenadinesSub-Saharan Africa Sub-Saharan Africa (excluding high income)Sub-Saharan Africa (IDA & IBRD countries)SudanSurinameSwazilandSwedenSwitzerlandSyrian Arab RepublicTajikistanTanzaniaThailandTimor-LesteTogoTongaTrinidad and TobagoTunisiaTurkeyTuvaluUgandaUkraineUnited KingdomUnited StatesUpper middle incomeUruguayVanuatuVenezuela, RBVietnamWest Bank and GazaWorldYemen, Rep.ZambiaZimbabwe Timeline:
This timeline shows a graph from 1977 to 2016 of Papua New Guinea. No data until 1976. Number of actual observations by date: 40.
Source name:
World Development Indicators
Source organization:
International Monetary Fund, Balance of Payments Statistics Yearbook and data files.
Categories, topics:
Economy & Growth, Trade
Last updated:
apr 23, 2017
Indicators value changes by year
Minimum:
434.198 mln
jan 1, 1977
Maximum:
5.419 bln
jan 1, 2014
At the date of observation
Value
Absolute change
Change from previous value
jan 1, 1977
434.198 mln
+434.198 mln
0.0%
jan 1, 1978
559.887 mln
+125.689 mln
28.95%
jan 1, 1979
688.358 mln
+128.471 mln
22.95%
jan 1, 1980
783.344 mln
+94.986 mln
13.8%
jan 1, 1981
1.021 bln
+237.162 mln
30.28%
jan 1, 1982
1.096 bln
+75.9 mln
7.44%
jan 1, 1983
1.018 bln
-78.841 mln
-7.19%
jan 1, 1984
974.767 mln
-42.797 mln
-4.21%
jan 1, 1985
962.785 mln
-11.982 mln
-1.23%
jan 1, 1986
874.773 mln
-88.013 mln
-9.14%
jan 1, 1987
928.832 mln
+54.059 mln
6.18%
jan 1, 1988
1.13 bln
+200.726 mln
21.61%
jan 1, 1989
1.384 bln
+254.892 mln
22.57%
jan 1, 1990
1.341 bln
-43.152 mln
-3.12%
jan 1, 1991
1.106 bln
-235.367 mln
-17.55%
jan 1, 1992
1.404 bln
+297.992 mln
26.94%
jan 1, 1993
1.323 bln
-81.052 mln
-5.77%
jan 1, 1994
1.135 bln
-188.222 mln
-14.23%
jan 1, 1995
1.325 bln
+190.247 mln
16.77%
jan 1, 1996
1.262 bln
-62.494 mln
-4.72%
jan 1, 1997
1.513 bln
+250.847 mln
19.87%
jan 1, 1998
1.483 bln
-29.955 mln
-1.98%
jan 1, 1999
1.078 bln
-404.997 mln
-27.3%
jan 1, 2000
1.071 bln
-6.872 mln
-0.64%
jan 1, 2001
998.799 mln
-72.628 mln
-6.78%
jan 1, 2002
932.394 mln
-66.405 mln
-6.65%
jan 1, 2003
1.077 bln
+145.029 mln
15.55%
jan 1, 2004
1.187 bln
+109.881 mln
10.2%
jan 1, 2005
1.459 bln
+272.042 mln
22.91%
jan 1, 2006
1.525 bln
+65.921 mln
4.52%
jan 1, 2007
1.991 bln
+465.256 mln
30.5%
jan 1, 2008
2.629 bln
+638.749 mln
32.09%
jan 1, 2009
3.14 bln
+510.885 mln
19.43%
jan 1, 2010
2.871 bln
-269.489 mln
-8.58%
jan 1, 2011
3.529 bln
+658.226 mln
22.93%
jan 1, 2012
4.241 bln
+711.607 mln
20.17%
jan 1, 2013
4.767 bln
+526.09 mln
12.41%
jan 1, 2014
5.419 bln
+651.919 mln
13.68%
jan 1, 2015
4.008 bln
-1.411 bln
-26.04%
jan 1, 2016
2.42 bln
-1.588 bln
-39.61%
Ranking of countries by current statistics by years


Comments: