29
/
en
AIzaSyAYiBZKx7MnpbEhh9jyipgxe19OcubqV5w
April 1, 2024
232262
Samoa
WSM
true
2
1
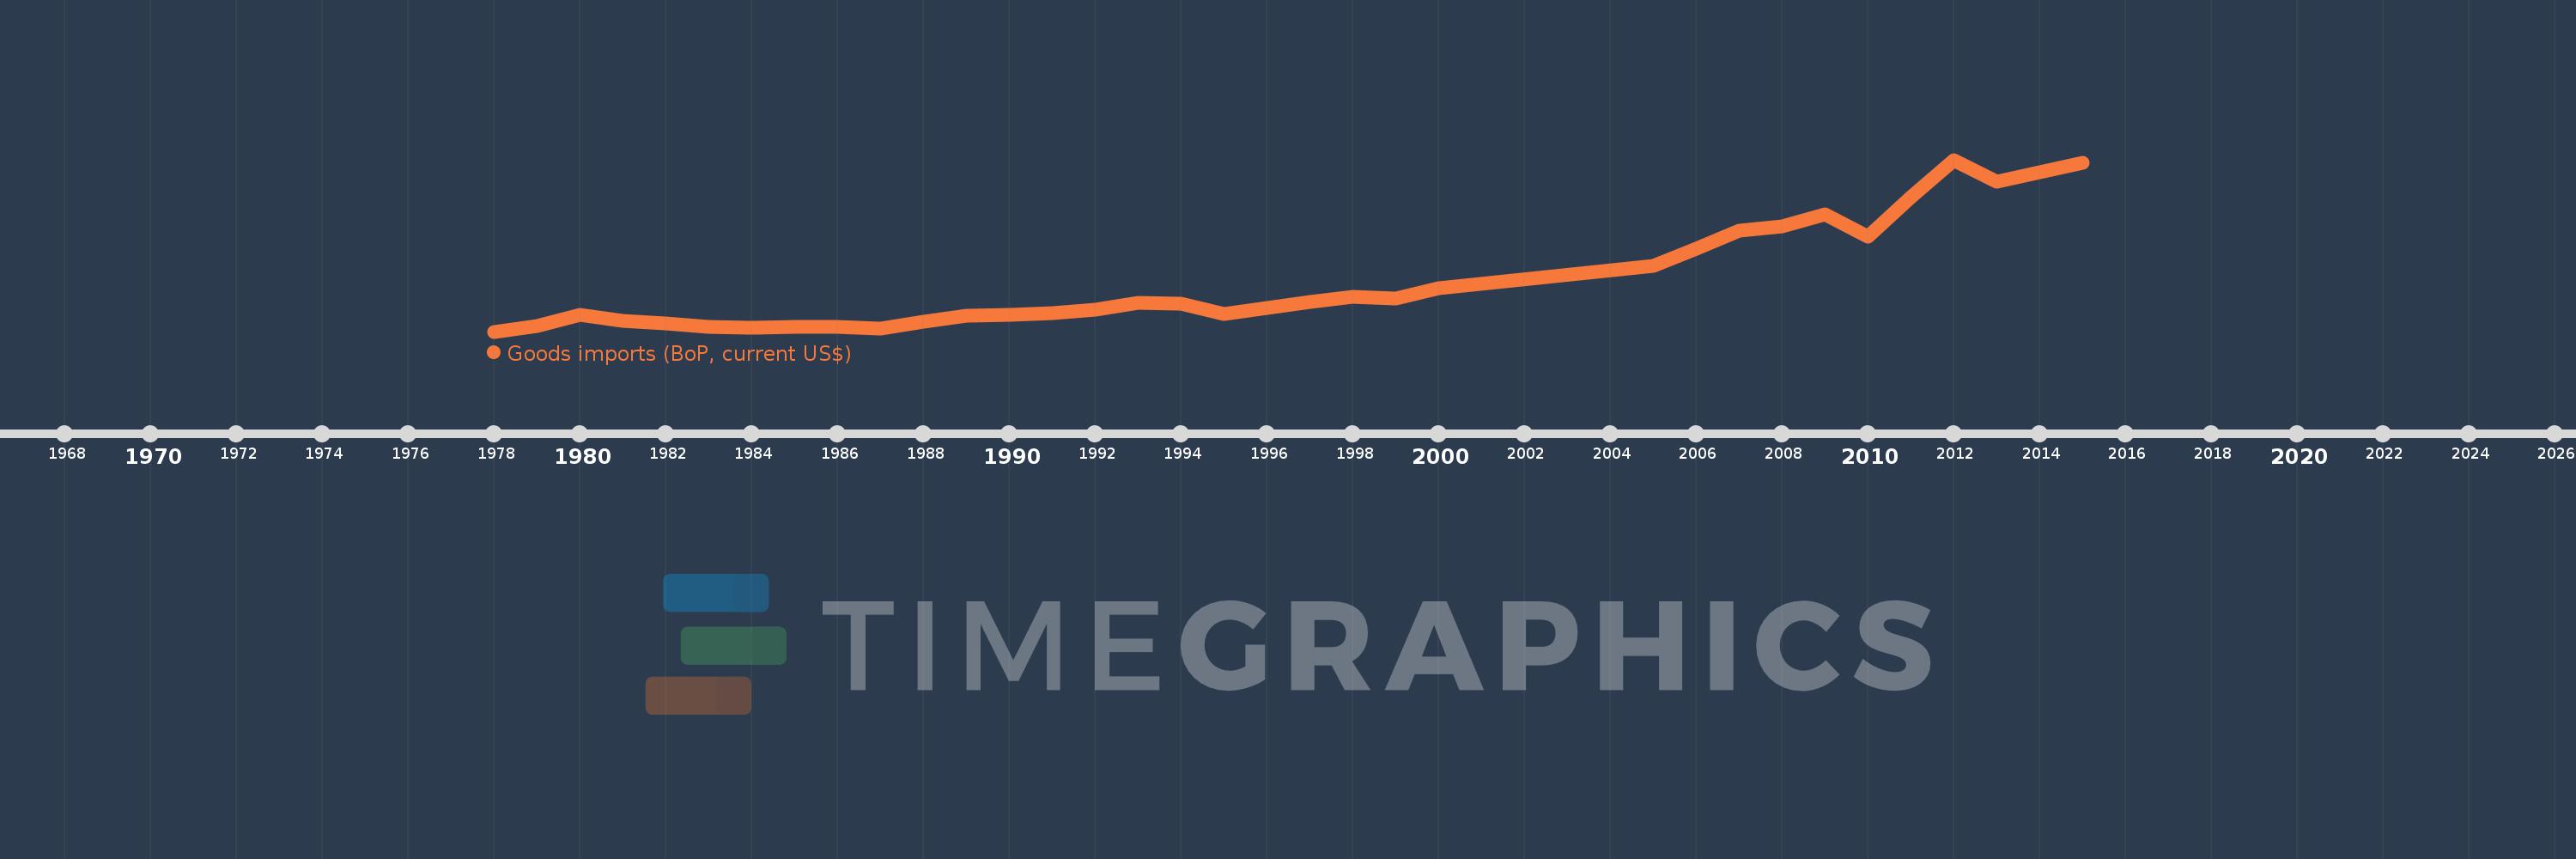
Goods imports (BoP, current US$)
2015,2014,2013,2012,2011,2010,2009,2008,2007,2006,2005,2000,1999,1998,1997,1996,1995,1994,1993,1992,1991,1990,1989,1988,1987,1986,1985,1984,1983,1982,1981,1980,1979,1978
This statistics in other country:
AfghanistanAlbaniaAlgeriaAngolaAntigua and BarbudaArab WorldArgentinaArmeniaArubaAustraliaAustriaAzerbaijanBahamas, TheBahrainBangladeshBarbadosBelarusBelgiumBelizeBeninBermudaBhutanBoliviaBosnia and HerzegovinaBotswanaBrazilBrunei DarussalamBulgariaBurkina FasoBurundiCabo VerdeCambodiaCameroonCanadaCaribbean small statesCentral African RepublicCentral Europe and the BalticsChadChileChinaColombiaComorosCongo, Dem. Rep.Congo, Rep.Costa RicaCote d'IvoireCroatiaCuracaoCyprusCzech RepublicDenmarkDjiboutiDominicaDominican RepublicEarly-demographic dividendEast Asia & PacificEast Asia & Pacific (excluding high income)East Asia & Pacific (IDA & IBRD countries)EcuadorEgypt, Arab Rep.El SalvadorEquatorial GuineaEritreaEstoniaEthiopiaEuro areaEurope & Central AsiaEurope & Central Asia (excluding high income)Europe & Central Asia (IDA & IBRD countries)European UnionFaroe IslandsFijiFinlandFragile and conflict affected situationsFranceFrench PolynesiaGabonGambia, TheGeorgiaGermanyGhanaGreeceGrenadaGuatemalaGuineaGuinea-BissauGuyanaHaitiHeavily indebted poor countries (HIPC)High incomeHondurasHong Kong SAR, ChinaHungaryIBRD onlyIcelandIDA & IBRD totalIDA blendIDA onlyIDA totalIndiaIndonesiaIran, Islamic Rep.IraqIrelandIsraelItalyJamaicaJapanJordanKazakhstanKenyaKiribatiKorea, Rep.KosovoKuwaitKyrgyz RepublicLao PDRLate-demographic dividendLatin America & Caribbean Latin America & Caribbean (excluding high income)Latin America & the Caribbean (IDA & IBRD countries)LatviaLeast developed countries: UN classificationLebanonLesothoLiberiaLibyaLithuaniaLow & middle incomeLow incomeLower middle incomeLuxembourgMacao SAR, ChinaMacedonia, FYRMadagascarMalawiMalaysiaMaldivesMaliMaltaMarshall IslandsMauritaniaMauritiusMexicoMicronesia, Fed. Sts.Middle East & North Africa (excluding high income)Middle East & North Africa (IDA & IBRD countries)Middle incomeMoldovaMongoliaMontenegroMoroccoMozambiqueMyanmarNamibiaNepalNetherlandsNew CaledoniaNew ZealandNicaraguaNigerNigeriaNorth AmericaNorwayOECD membersOmanOther small statesPacific island small statesPakistanPalauPanamaPapua New GuineaParaguayPeruPhilippinesPolandPortugalPost-demographic dividendPre-demographic dividendQatarRomaniaRussian FederationRwandaSamoaSao Tome and PrincipeSaudi ArabiaSenegalSerbiaSeychellesSierra LeoneSingaporeSint Maarten (Dutch part)Slovak RepublicSloveniaSmall statesSolomon IslandsSouth AfricaSouth AsiaSouth Asia (IDA & IBRD)South SudanSpainSri LankaSt. Kitts and NevisSt. LuciaSt. Vincent and the GrenadinesSub-Saharan Africa Sub-Saharan Africa (excluding high income)Sub-Saharan Africa (IDA & IBRD countries)SudanSurinameSwazilandSwedenSwitzerlandSyrian Arab RepublicTajikistanTanzaniaThailandTimor-LesteTogoTongaTrinidad and TobagoTunisiaTurkeyTuvaluUgandaUkraineUnited KingdomUnited StatesUpper middle incomeUruguayVanuatuVenezuela, RBVietnamWest Bank and GazaWorldYemen, Rep.ZambiaZimbabwe Timeline:
This timeline shows a graph from 1978 to 2015 of Samoa. No data until 1977. Number of actual observations by date: 34.
Source name:
World Development Indicators
Source organization:
International Monetary Fund, Balance of Payments Statistics Yearbook and data files.
Categories, topics:
Economy & Growth, Trade
Last updated:
apr 23, 2017
Indicators value changes by year
Minimum:
37.337 mln
jan 1, 1978
Maximum:
347.185 mln
jan 1, 2012
At the date of observation
Value
Absolute change
Change from previous value
jan 1, 1978
37.337 mln
+37.337 mln
0.0%
jan 1, 1979
47.655 mln
+10.318 mln
27.63%
jan 1, 1980
67.154 mln
+19.499 mln
40.92%
jan 1, 1981
56.858 mln
-10.296 mln
-15.33%
jan 1, 1982
51.379 mln
-5.479 mln
-9.64%
jan 1, 1983
45.315 mln
-6.064 mln
-11.8%
jan 1, 1984
44.115 mln
-1.2 mln
-2.65%
jan 1, 1985
45.551 mln
+1.436 mln
3.26%
jan 1, 1986
46.6 mln
+1.049 mln
2.3%
jan 1, 1987
42.844 mln
-3.756 mln
-8.06%
jan 1, 1988
55.789 mln
+12.944 mln
30.21%
jan 1, 1989
66.568 mln
+10.779 mln
19.32%
jan 1, 1990
66.99 mln
+422.183K
0.63%
jan 1, 1991
70.165 mln
+3.175 mln
4.74%
jan 1, 1992
77.583 mln
+7.418 mln
10.57%
jan 1, 1993
89.895 mln
+12.312 mln
15.87%
jan 1, 1994
87.413 mln
-2.482 mln
-2.76%
jan 1, 1995
68.812 mln
-18.602 mln
-21.28%
jan 1, 1996
80.29 mln
+11.479 mln
16.68%
jan 1, 1997
90.757 mln
+10.467 mln
13.04%
jan 1, 1998
100.114 mln
+9.357 mln
10.31%
jan 1, 1999
96.913 mln
-3.201 mln
-3.2%
jan 1, 2000
115.66 mln
+18.746 mln
19.34%
jan 1, 2005
155.377 mln
+39.718 mln
34.34%
jan 1, 2006
187.164 mln
+31.787 mln
20.46%
jan 1, 2007
218.855 mln
+31.691 mln
16.93%
jan 1, 2008
227.096 mln
+8.24 mln
3.77%
jan 1, 2009
248.994 mln
+21.899 mln
9.64%
jan 1, 2010
207.861 mln
-41.133 mln
-16.52%
jan 1, 2011
279.99 mln
+72.129 mln
34.7%
jan 1, 2012
347.185 mln
+67.196 mln
24.0%
jan 1, 2013
308.43 mln
-38.756 mln
-11.16%
jan 1, 2014
325.371 mln
+16.941 mln
5.49%
jan 1, 2015
341.315 mln
+15.944 mln
4.9%
Ranking of countries by current statistics by years


Comments: