29
/
en
AIzaSyAYiBZKx7MnpbEhh9jyipgxe19OcubqV5w
April 1, 2024
249904
St. Kitts and Nevis
KNA
true
2
1
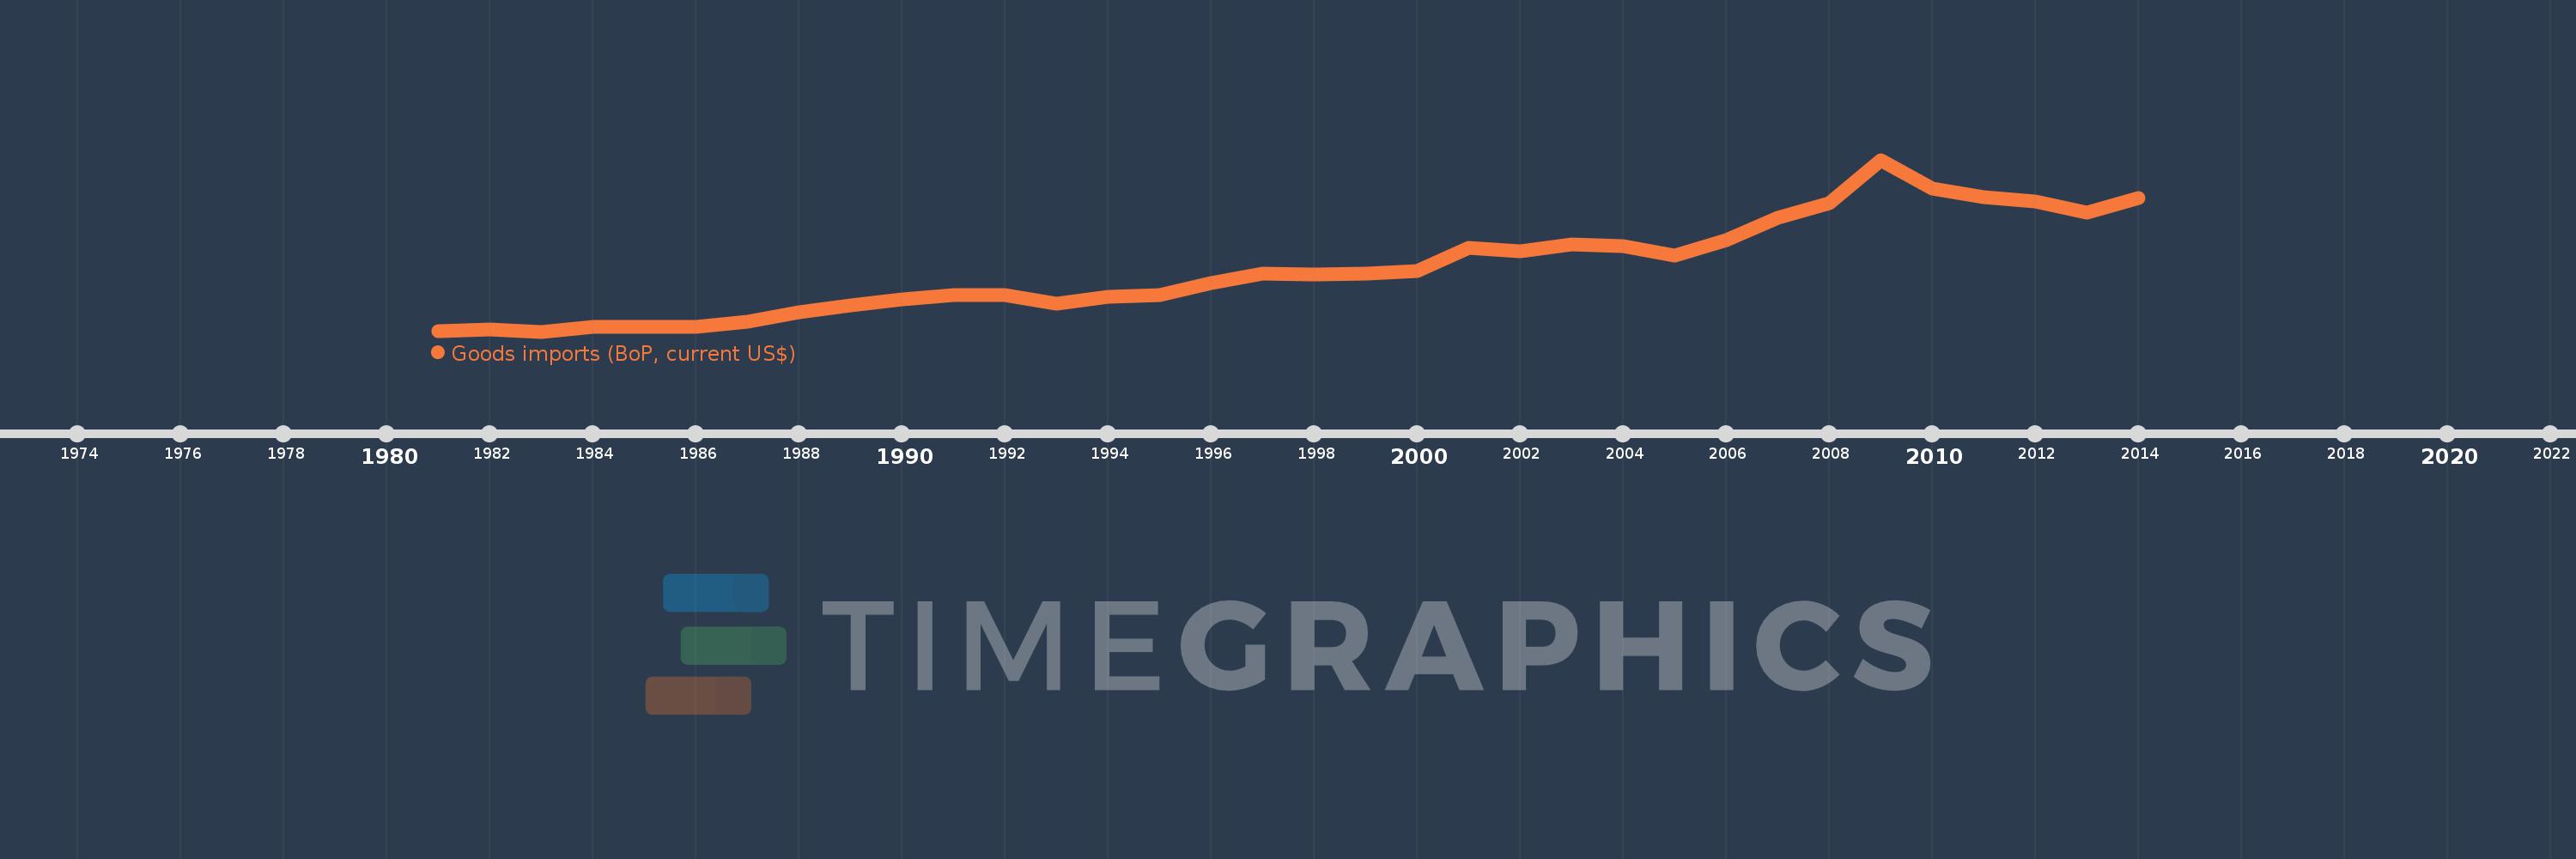
Goods imports (BoP, current US$)
2014,2013,2012,2011,2010,2009,2008,2007,2006,2005,2004,2003,2002,2001,2000,1999,1998,1997,1996,1995,1994,1993,1992,1991,1990,1989,1988,1987,1986,1985,1984,1983,1982,1981
This statistics in other country:
AfghanistanAlbaniaAlgeriaAngolaAntigua and BarbudaArab WorldArgentinaArmeniaArubaAustraliaAustriaAzerbaijanBahamas, TheBahrainBangladeshBarbadosBelarusBelgiumBelizeBeninBermudaBhutanBoliviaBosnia and HerzegovinaBotswanaBrazilBrunei DarussalamBulgariaBurkina FasoBurundiCabo VerdeCambodiaCameroonCanadaCaribbean small statesCentral African RepublicCentral Europe and the BalticsChadChileChinaColombiaComorosCongo, Dem. Rep.Congo, Rep.Costa RicaCote d'IvoireCroatiaCuracaoCyprusCzech RepublicDenmarkDjiboutiDominicaDominican RepublicEarly-demographic dividendEast Asia & PacificEast Asia & Pacific (excluding high income)East Asia & Pacific (IDA & IBRD countries)EcuadorEgypt, Arab Rep.El SalvadorEquatorial GuineaEritreaEstoniaEthiopiaEuro areaEurope & Central AsiaEurope & Central Asia (excluding high income)Europe & Central Asia (IDA & IBRD countries)European UnionFaroe IslandsFijiFinlandFragile and conflict affected situationsFranceFrench PolynesiaGabonGambia, TheGeorgiaGermanyGhanaGreeceGrenadaGuatemalaGuineaGuinea-BissauGuyanaHaitiHeavily indebted poor countries (HIPC)High incomeHondurasHong Kong SAR, ChinaHungaryIBRD onlyIcelandIDA & IBRD totalIDA blendIDA onlyIDA totalIndiaIndonesiaIran, Islamic Rep.IraqIrelandIsraelItalyJamaicaJapanJordanKazakhstanKenyaKiribatiKorea, Rep.KosovoKuwaitKyrgyz RepublicLao PDRLate-demographic dividendLatin America & Caribbean Latin America & Caribbean (excluding high income)Latin America & the Caribbean (IDA & IBRD countries)LatviaLeast developed countries: UN classificationLebanonLesothoLiberiaLibyaLithuaniaLow & middle incomeLow incomeLower middle incomeLuxembourgMacao SAR, ChinaMacedonia, FYRMadagascarMalawiMalaysiaMaldivesMaliMaltaMarshall IslandsMauritaniaMauritiusMexicoMicronesia, Fed. Sts.Middle East & North Africa (excluding high income)Middle East & North Africa (IDA & IBRD countries)Middle incomeMoldovaMongoliaMontenegroMoroccoMozambiqueMyanmarNamibiaNepalNetherlandsNew CaledoniaNew ZealandNicaraguaNigerNigeriaNorth AmericaNorwayOECD membersOmanOther small statesPacific island small statesPakistanPalauPanamaPapua New GuineaParaguayPeruPhilippinesPolandPortugalPost-demographic dividendPre-demographic dividendQatarRomaniaRussian FederationRwandaSamoaSao Tome and PrincipeSaudi ArabiaSenegalSerbiaSeychellesSierra LeoneSingaporeSint Maarten (Dutch part)Slovak RepublicSloveniaSmall statesSolomon IslandsSouth AfricaSouth AsiaSouth Asia (IDA & IBRD)South SudanSpainSri LankaSt. Kitts and NevisSt. LuciaSt. Vincent and the GrenadinesSub-Saharan Africa Sub-Saharan Africa (excluding high income)Sub-Saharan Africa (IDA & IBRD countries)SudanSurinameSwazilandSwedenSwitzerlandSyrian Arab RepublicTajikistanTanzaniaThailandTimor-LesteTogoTongaTrinidad and TobagoTunisiaTurkeyTuvaluUgandaUkraineUnited KingdomUnited StatesUpper middle incomeUruguayVanuatuVenezuela, RBVietnamWest Bank and GazaWorldYemen, Rep.ZambiaZimbabwe Timeline:
This timeline shows a graph from 1981 to 2014 of St. Kitts and Nevis. No data until 1980. Number of actual observations by date: 34.
Source name:
World Development Indicators
Source organization:
International Monetary Fund, Balance of Payments Statistics Yearbook and data files.
Categories, topics:
Economy & Growth, Trade
Last updated:
apr 23, 2017
Indicators value changes by year
Minimum:
39.822 mln
jan 1, 1983
Maximum:
311.913 mln
jan 1, 2009
At the date of observation
Value
Absolute change
Change from previous value
jan 1, 1981
40.804 mln
+40.804 mln
0.0%
jan 1, 1982
43.422 mln
+2.619 mln
6.42%
jan 1, 1983
39.822 mln
-3.6 mln
-8.29%
jan 1, 1984
46.744 mln
+6.922 mln
17.38%
jan 1, 1985
47.233 mln
+488.889K
1.05%
jan 1, 1986
46.7 mln
-533.333K
-1.13%
jan 1, 1987
55.348 mln
+8.648 mln
18.52%
jan 1, 1988
69.956 mln
+14.607 mln
26.39%
jan 1, 1989
81.963 mln
+12.007 mln
17.16%
jan 1, 1990
90.185 mln
+8.222 mln
10.03%
jan 1, 1991
97.441 mln
+7.256 mln
8.05%
jan 1, 1992
97.048 mln
-392.593K
-0.4%
jan 1, 1993
84.152 mln
-12.896 mln
-13.29%
jan 1, 1994
94.567 mln
+10.415 mln
12.38%
jan 1, 1995
98.267 mln
+3.7 mln
3.91%
jan 1, 1996
117.122 mln
+18.856 mln
19.19%
jan 1, 1997
131.926 mln
+14.804 mln
12.64%
jan 1, 1998
130.956 mln
-970.37K
-0.74%
jan 1, 1999
130.989 mln
+33.333K
0.03%
jan 1, 2000
135.189 mln
+4.2 mln
3.21%
jan 1, 2001
172.67 mln
+37.481 mln
27.73%
jan 1, 2002
166.581 mln
-6.09 mln
-3.53%
jan 1, 2003
177.584 mln
+11.004 mln
6.61%
jan 1, 2004
175.642 mln
-1.943 mln
-1.09%
jan 1, 2005
160.819 mln
-14.822 mln
-8.44%
jan 1, 2006
185.213 mln
+24.393 mln
15.17%
jan 1, 2007
219.574 mln
+34.362 mln
18.55%
jan 1, 2008
242.954 mln
+23.38 mln
10.65%
jan 1, 2009
311.913 mln
+68.959 mln
28.38%
jan 1, 2010
265.693 mln
-46.22 mln
-14.82%
jan 1, 2011
252.676 mln
-13.017 mln
-4.9%
jan 1, 2012
246.359 mln
-6.317 mln
-2.5%
jan 1, 2013
227.743 mln
-18.615 mln
-7.56%
jan 1, 2014
251.254 mln
+23.511 mln
10.32%
Ranking of countries by current statistics by years


Comments: