29
/
en
AIzaSyAYiBZKx7MnpbEhh9jyipgxe19OcubqV5w
April 1, 2024
144406
Guatemala
GTM
true
2
1
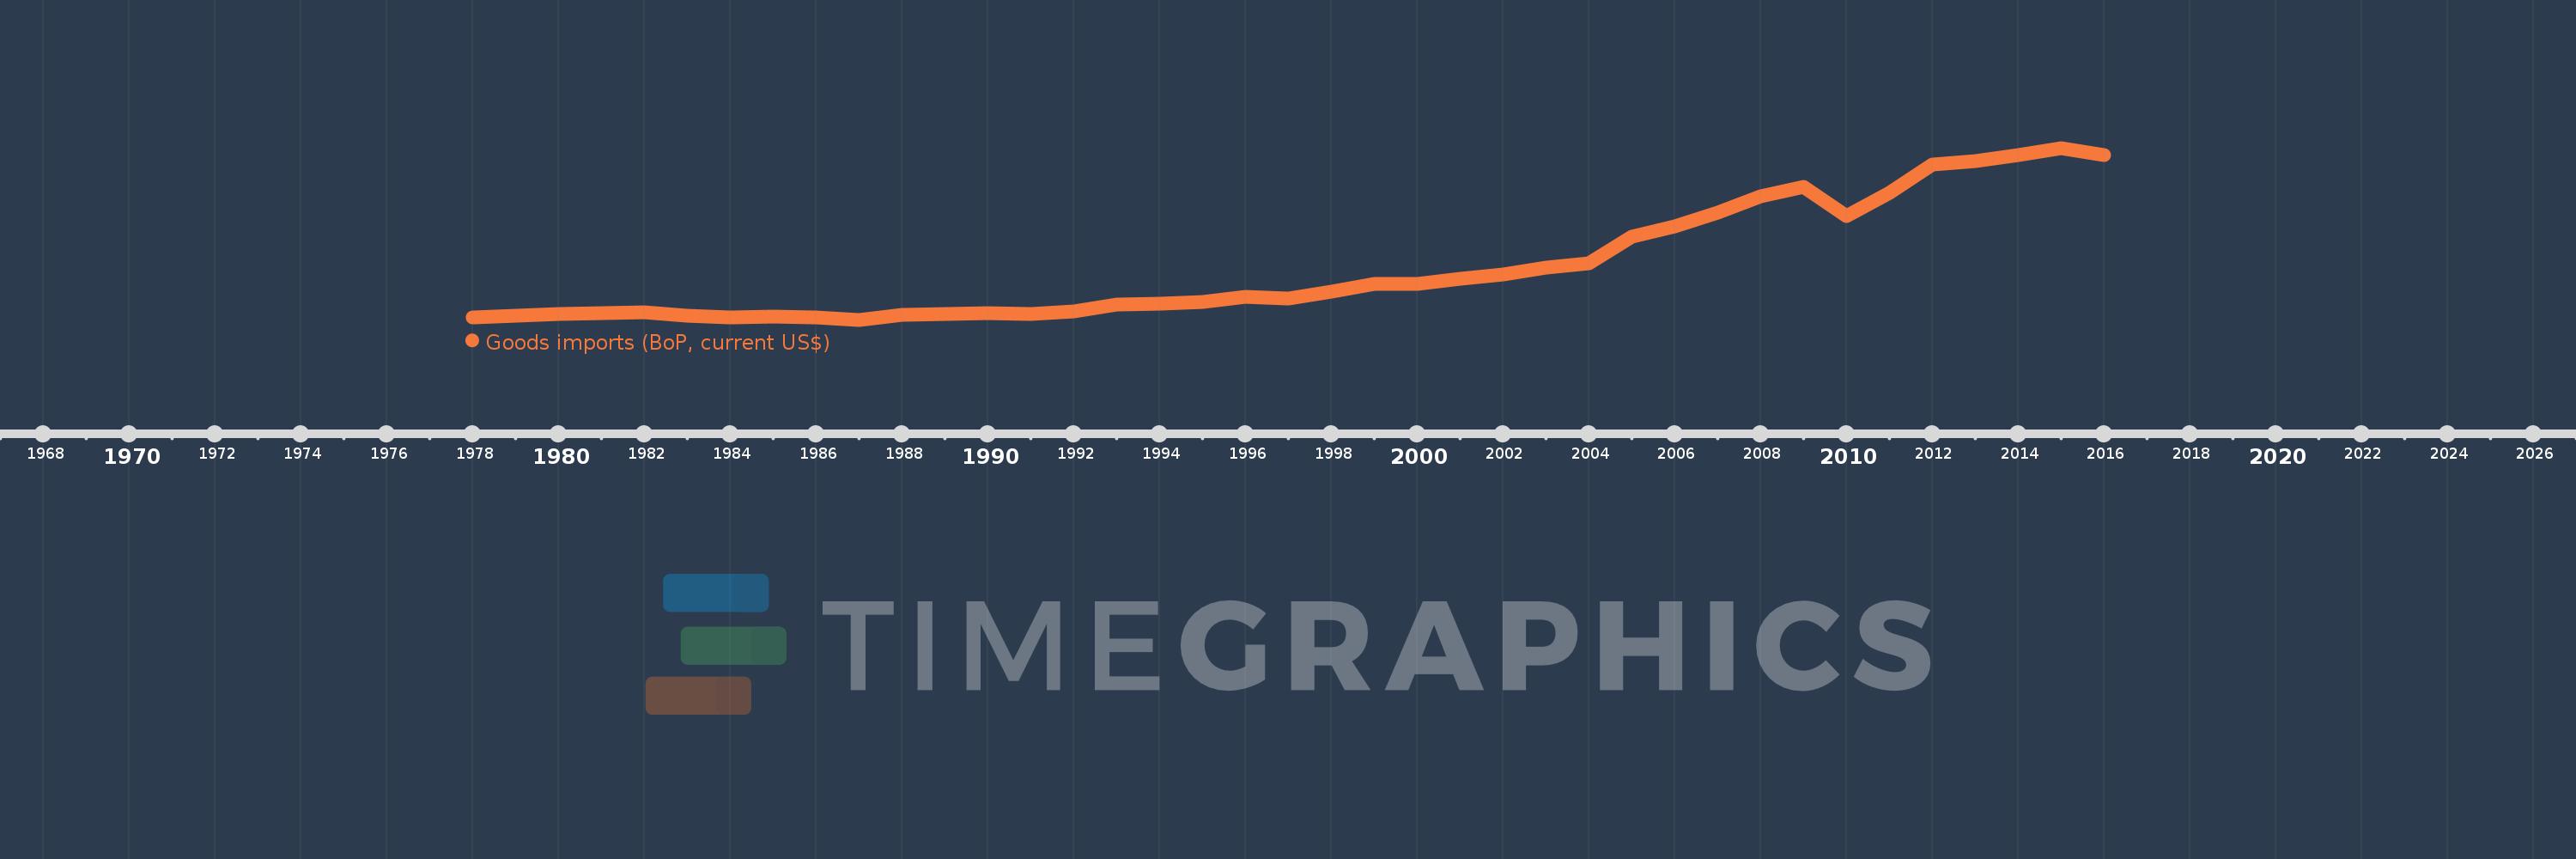
Goods imports (BoP, current US$)
2016,2015,2014,2013,2012,2011,2010,2009,2008,2007,2006,2005,2004,2003,2002,2001,2000,1999,1998,1997,1996,1995,1994,1993,1992,1991,1990,1989,1988,1987,1986,1985,1984,1983,1982,1981,1980,1979,1978
This statistics in other country:
AfghanistanAlbaniaAlgeriaAngolaAntigua and BarbudaArab WorldArgentinaArmeniaArubaAustraliaAustriaAzerbaijanBahamas, TheBahrainBangladeshBarbadosBelarusBelgiumBelizeBeninBermudaBhutanBoliviaBosnia and HerzegovinaBotswanaBrazilBrunei DarussalamBulgariaBurkina FasoBurundiCabo VerdeCambodiaCameroonCanadaCaribbean small statesCentral African RepublicCentral Europe and the BalticsChadChileChinaColombiaComorosCongo, Dem. Rep.Congo, Rep.Costa RicaCote d'IvoireCroatiaCuracaoCyprusCzech RepublicDenmarkDjiboutiDominicaDominican RepublicEarly-demographic dividendEast Asia & PacificEast Asia & Pacific (excluding high income)East Asia & Pacific (IDA & IBRD countries)EcuadorEgypt, Arab Rep.El SalvadorEquatorial GuineaEritreaEstoniaEthiopiaEuro areaEurope & Central AsiaEurope & Central Asia (excluding high income)Europe & Central Asia (IDA & IBRD countries)European UnionFaroe IslandsFijiFinlandFragile and conflict affected situationsFranceFrench PolynesiaGabonGambia, TheGeorgiaGermanyGhanaGreeceGrenadaGuatemalaGuineaGuinea-BissauGuyanaHaitiHeavily indebted poor countries (HIPC)High incomeHondurasHong Kong SAR, ChinaHungaryIBRD onlyIcelandIDA & IBRD totalIDA blendIDA onlyIDA totalIndiaIndonesiaIran, Islamic Rep.IraqIrelandIsraelItalyJamaicaJapanJordanKazakhstanKenyaKiribatiKorea, Rep.KosovoKuwaitKyrgyz RepublicLao PDRLate-demographic dividendLatin America & Caribbean Latin America & Caribbean (excluding high income)Latin America & the Caribbean (IDA & IBRD countries)LatviaLeast developed countries: UN classificationLebanonLesothoLiberiaLibyaLithuaniaLow & middle incomeLow incomeLower middle incomeLuxembourgMacao SAR, ChinaMacedonia, FYRMadagascarMalawiMalaysiaMaldivesMaliMaltaMarshall IslandsMauritaniaMauritiusMexicoMicronesia, Fed. Sts.Middle East & North Africa (excluding high income)Middle East & North Africa (IDA & IBRD countries)Middle incomeMoldovaMongoliaMontenegroMoroccoMozambiqueMyanmarNamibiaNepalNetherlandsNew CaledoniaNew ZealandNicaraguaNigerNigeriaNorth AmericaNorwayOECD membersOmanOther small statesPacific island small statesPakistanPalauPanamaPapua New GuineaParaguayPeruPhilippinesPolandPortugalPost-demographic dividendPre-demographic dividendQatarRomaniaRussian FederationRwandaSamoaSao Tome and PrincipeSaudi ArabiaSenegalSerbiaSeychellesSierra LeoneSingaporeSint Maarten (Dutch part)Slovak RepublicSloveniaSmall statesSolomon IslandsSouth AfricaSouth AsiaSouth Asia (IDA & IBRD)South SudanSpainSri LankaSt. Kitts and NevisSt. LuciaSt. Vincent and the GrenadinesSub-Saharan Africa Sub-Saharan Africa (excluding high income)Sub-Saharan Africa (IDA & IBRD countries)SudanSurinameSwazilandSwedenSwitzerlandSyrian Arab RepublicTajikistanTanzaniaThailandTimor-LesteTogoTongaTrinidad and TobagoTunisiaTurkeyTuvaluUgandaUkraineUnited KingdomUnited StatesUpper middle incomeUruguayVanuatuVenezuela, RBVietnamWest Bank and GazaWorldYemen, Rep.ZambiaZimbabwe Timeline:
This timeline shows a graph from 1978 to 2016 of Guatemala. No data until 1977. Number of actual observations by date: 39.
Source name:
World Development Indicators
Source organization:
International Monetary Fund, Balance of Payments Statistics Yearbook and data files.
Categories, topics:
Economy & Growth, Trade
Last updated:
apr 23, 2017
Indicators value changes by year
Minimum:
875.7 mln
jan 1, 1987
Maximum:
17.056 bln
jan 1, 2015
At the date of observation
Value
Absolute change
Change from previous value
jan 1, 1978
1.087 bln
+1.087 bln
0.0%
jan 1, 1979
1.284 bln
+196.8 mln
18.1%
jan 1, 1980
1.402 bln
+117.9 mln
9.18%
jan 1, 1981
1.473 bln
+70.9 mln
5.06%
jan 1, 1982
1.54 bln
+67.4 mln
4.58%
jan 1, 1983
1.284 bln
-255.7 mln
-16.6%
jan 1, 1984
1.056 bln
-228.3 mln
-17.78%
jan 1, 1985
1.182 bln
+126.2 mln
11.95%
jan 1, 1986
1.077 bln
-105.5 mln
-8.92%
jan 1, 1987
875.7 mln
-201.0 mln
-18.67%
jan 1, 1988
1.333 bln
+457.5 mln
52.24%
jan 1, 1989
1.413 bln
+80.0 mln
6.0%
jan 1, 1990
1.484 bln
+71.2 mln
5.04%
jan 1, 1991
1.428 bln
-56.4 mln
-3.8%
jan 1, 1992
1.673 bln
+245.0 mln
17.16%
jan 1, 1993
2.328 bln
+654.8 mln
39.14%
jan 1, 1994
2.384 bln
+56.2 mln
2.41%
jan 1, 1995
2.547 bln
+162.6 mln
6.82%
jan 1, 1996
3.033 bln
+486.0 mln
19.08%
jan 1, 1997
2.88 bln
-152.3 mln
-5.02%
jan 1, 1998
3.543 bln
+662.4 mln
23.0%
jan 1, 1999
4.256 bln
+713.0 mln
20.13%
jan 1, 2000
4.226 bln
-30.0 mln
-0.7%
jan 1, 2001
4.742 bln
+516.3 mln
12.22%
jan 1, 2002
5.142 bln
+400.005 mln
8.44%
jan 1, 2003
5.791 bln
+649.001 mln
12.62%
jan 1, 2004
6.176 bln
+384.722 mln
6.64%
jan 1, 2005
8.737 bln
+2.561 bln
41.47%
jan 1, 2006
9.65 bln
+913.1 mln
10.45%
jan 1, 2007
10.934 bln
+1.284 bln
13.31%
jan 1, 2008
12.47 bln
+1.536 bln
14.05%
jan 1, 2009
13.421 bln
+951.009 mln
7.63%
jan 1, 2010
10.643 bln
-2.778 bln
-20.7%
jan 1, 2011
12.807 bln
+2.163 bln
20.33%
jan 1, 2012
15.482 bln
+2.676 bln
20.89%
jan 1, 2013
15.838 bln
+355.679 mln
2.3%
jan 1, 2014
16.359 bln
+521.055 mln
3.29%
jan 1, 2015
17.056 bln
+697.101 mln
4.26%
jan 1, 2016
16.381 bln
-675.301 mln
-3.96%
Ranking of countries by current statistics by years


Comments: