29
/
en
AIzaSyAYiBZKx7MnpbEhh9jyipgxe19OcubqV5w
April 1, 2024
216460
Pakistan
PAK
true
2
1
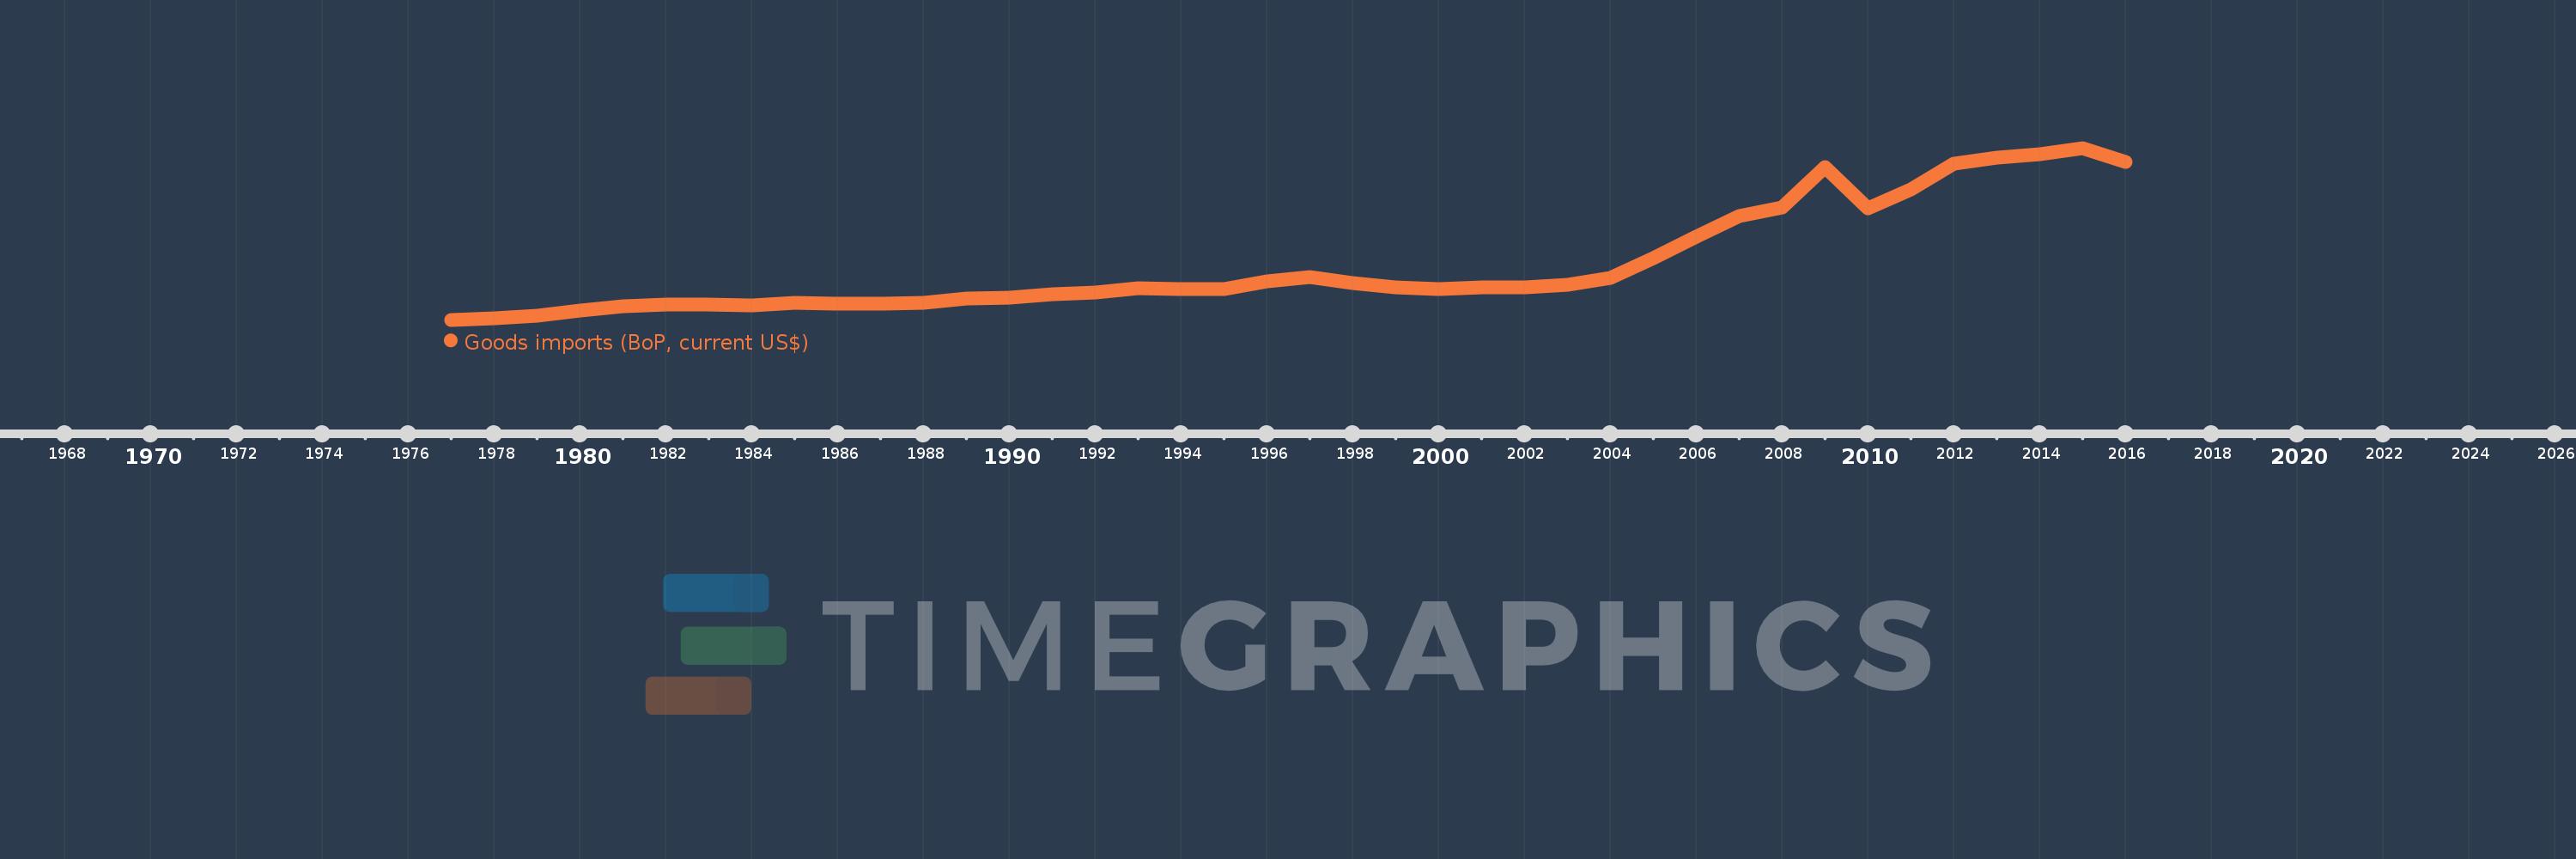
Goods imports (BoP, current US$)
2016,2015,2014,2013,2012,2011,2010,2009,2008,2007,2006,2005,2004,2003,2002,2001,2000,1999,1998,1997,1996,1995,1994,1993,1992,1991,1990,1989,1988,1987,1986,1985,1984,1983,1982,1981,1980,1979,1978,1977
This statistics in other country:
AfghanistanAlbaniaAlgeriaAngolaAntigua and BarbudaArab WorldArgentinaArmeniaArubaAustraliaAustriaAzerbaijanBahamas, TheBahrainBangladeshBarbadosBelarusBelgiumBelizeBeninBermudaBhutanBoliviaBosnia and HerzegovinaBotswanaBrazilBrunei DarussalamBulgariaBurkina FasoBurundiCabo VerdeCambodiaCameroonCanadaCaribbean small statesCentral African RepublicCentral Europe and the BalticsChadChileChinaColombiaComorosCongo, Dem. Rep.Congo, Rep.Costa RicaCote d'IvoireCroatiaCuracaoCyprusCzech RepublicDenmarkDjiboutiDominicaDominican RepublicEarly-demographic dividendEast Asia & PacificEast Asia & Pacific (excluding high income)East Asia & Pacific (IDA & IBRD countries)EcuadorEgypt, Arab Rep.El SalvadorEquatorial GuineaEritreaEstoniaEthiopiaEuro areaEurope & Central AsiaEurope & Central Asia (excluding high income)Europe & Central Asia (IDA & IBRD countries)European UnionFaroe IslandsFijiFinlandFragile and conflict affected situationsFranceFrench PolynesiaGabonGambia, TheGeorgiaGermanyGhanaGreeceGrenadaGuatemalaGuineaGuinea-BissauGuyanaHaitiHeavily indebted poor countries (HIPC)High incomeHondurasHong Kong SAR, ChinaHungaryIBRD onlyIcelandIDA & IBRD totalIDA blendIDA onlyIDA totalIndiaIndonesiaIran, Islamic Rep.IraqIrelandIsraelItalyJamaicaJapanJordanKazakhstanKenyaKiribatiKorea, Rep.KosovoKuwaitKyrgyz RepublicLao PDRLate-demographic dividendLatin America & Caribbean Latin America & Caribbean (excluding high income)Latin America & the Caribbean (IDA & IBRD countries)LatviaLeast developed countries: UN classificationLebanonLesothoLiberiaLibyaLithuaniaLow & middle incomeLow incomeLower middle incomeLuxembourgMacao SAR, ChinaMacedonia, FYRMadagascarMalawiMalaysiaMaldivesMaliMaltaMarshall IslandsMauritaniaMauritiusMexicoMicronesia, Fed. Sts.Middle East & North Africa (excluding high income)Middle East & North Africa (IDA & IBRD countries)Middle incomeMoldovaMongoliaMontenegroMoroccoMozambiqueMyanmarNamibiaNepalNetherlandsNew CaledoniaNew ZealandNicaraguaNigerNigeriaNorth AmericaNorwayOECD membersOmanOther small statesPacific island small statesPakistanPalauPanamaPapua New GuineaParaguayPeruPhilippinesPolandPortugalPost-demographic dividendPre-demographic dividendQatarRomaniaRussian FederationRwandaSamoaSao Tome and PrincipeSaudi ArabiaSenegalSerbiaSeychellesSierra LeoneSingaporeSint Maarten (Dutch part)Slovak RepublicSloveniaSmall statesSolomon IslandsSouth AfricaSouth AsiaSouth Asia (IDA & IBRD)South SudanSpainSri LankaSt. Kitts and NevisSt. LuciaSt. Vincent and the GrenadinesSub-Saharan Africa Sub-Saharan Africa (excluding high income)Sub-Saharan Africa (IDA & IBRD countries)SudanSurinameSwazilandSwedenSwitzerlandSyrian Arab RepublicTajikistanTanzaniaThailandTimor-LesteTogoTongaTrinidad and TobagoTunisiaTurkeyTuvaluUgandaUkraineUnited KingdomUnited StatesUpper middle incomeUruguayVanuatuVenezuela, RBVietnamWest Bank and GazaWorldYemen, Rep.ZambiaZimbabwe Timeline:
This timeline shows a graph from 1977 to 2016 of Pakistan. No data until 1976. Number of actual observations by date: 40.
Source name:
World Development Indicators
Source organization:
International Monetary Fund, Balance of Payments Statistics Yearbook and data files.
Categories, topics:
Economy & Growth, Trade
Last updated:
apr 23, 2017
Indicators value changes by year
Minimum:
2.202 bln
jan 1, 1977
Maximum:
42.654 bln
jan 1, 2015
At the date of observation
Value
Absolute change
Change from previous value
jan 1, 1977
2.202 bln
+2.202 bln
0.0%
jan 1, 1978
2.499 bln
+297.157 mln
13.49%
jan 1, 1979
3.236 bln
+737.006 mln
29.49%
jan 1, 1980
4.309 bln
+1.073 bln
33.16%
jan 1, 1981
5.47 bln
+1.161 bln
26.94%
jan 1, 1982
5.683 bln
+212.11 mln
3.88%
jan 1, 1983
5.771 bln
+88.309 mln
1.55%
jan 1, 1984
5.618 bln
-152.56 mln
-2.64%
jan 1, 1985
6.263 bln
+645.094 mln
11.48%
jan 1, 1986
5.906 bln
-357.47 mln
-5.71%
jan 1, 1987
5.999 bln
+93.273 mln
1.58%
jan 1, 1988
6.283 bln
+284.172 mln
4.74%
jan 1, 1989
7.131 bln
+847.514 mln
13.49%
jan 1, 1990
7.401 bln
+270.044 mln
3.79%
jan 1, 1991
8.133 bln
+731.608 mln
9.89%
jan 1, 1992
8.683 bln
+550.78 mln
6.77%
jan 1, 1993
9.717 bln
+1.033 bln
11.9%
jan 1, 1994
9.38 bln
-336.635 mln
-3.46%
jan 1, 1995
9.355 bln
-24.616 mln
-0.26%
jan 1, 1996
11.248 bln
+1.892 bln
20.23%
jan 1, 1997
12.164 bln
+915.971 mln
8.14%
jan 1, 1998
10.75 bln
-1.414 bln
-11.62%
jan 1, 1999
9.834 bln
-916.177 mln
-8.52%
jan 1, 2000
9.52 bln
-314.0 mln
-3.19%
jan 1, 2001
9.896 bln
+376.0 mln
3.95%
jan 1, 2002
9.741 bln
-155.0 mln
-1.57%
jan 1, 2003
10.428 bln
+687.0 mln
7.05%
jan 1, 2004
11.978 bln
+1.55 bln
14.86%
jan 1, 2005
16.643 bln
+4.665 bln
38.95%
jan 1, 2006
21.683 bln
+5.04 bln
30.28%
jan 1, 2007
26.597 bln
+4.914 bln
22.66%
jan 1, 2008
28.639 bln
+2.042 bln
7.68%
jan 1, 2009
38.132 bln
+9.493 bln
33.15%
jan 1, 2010
28.536 bln
-9.596 bln
-25.17%
jan 1, 2011
32.843 bln
+4.307 bln
15.09%
jan 1, 2012
38.995 bln
+6.152 bln
18.73%
jan 1, 2013
40.385 bln
+1.39 bln
3.56%
jan 1, 2014
41.214 bln
+829.0 mln
2.05%
jan 1, 2015
42.654 bln
+1.44 bln
3.49%
jan 1, 2016
39.292 bln
-3.362 bln
-7.88%
Ranking of countries by current statistics by years


Comments: