29
/
en
AIzaSyAYiBZKx7MnpbEhh9jyipgxe19OcubqV5w
April 1, 2024
260933
Tanzania
TZA
true
2
1
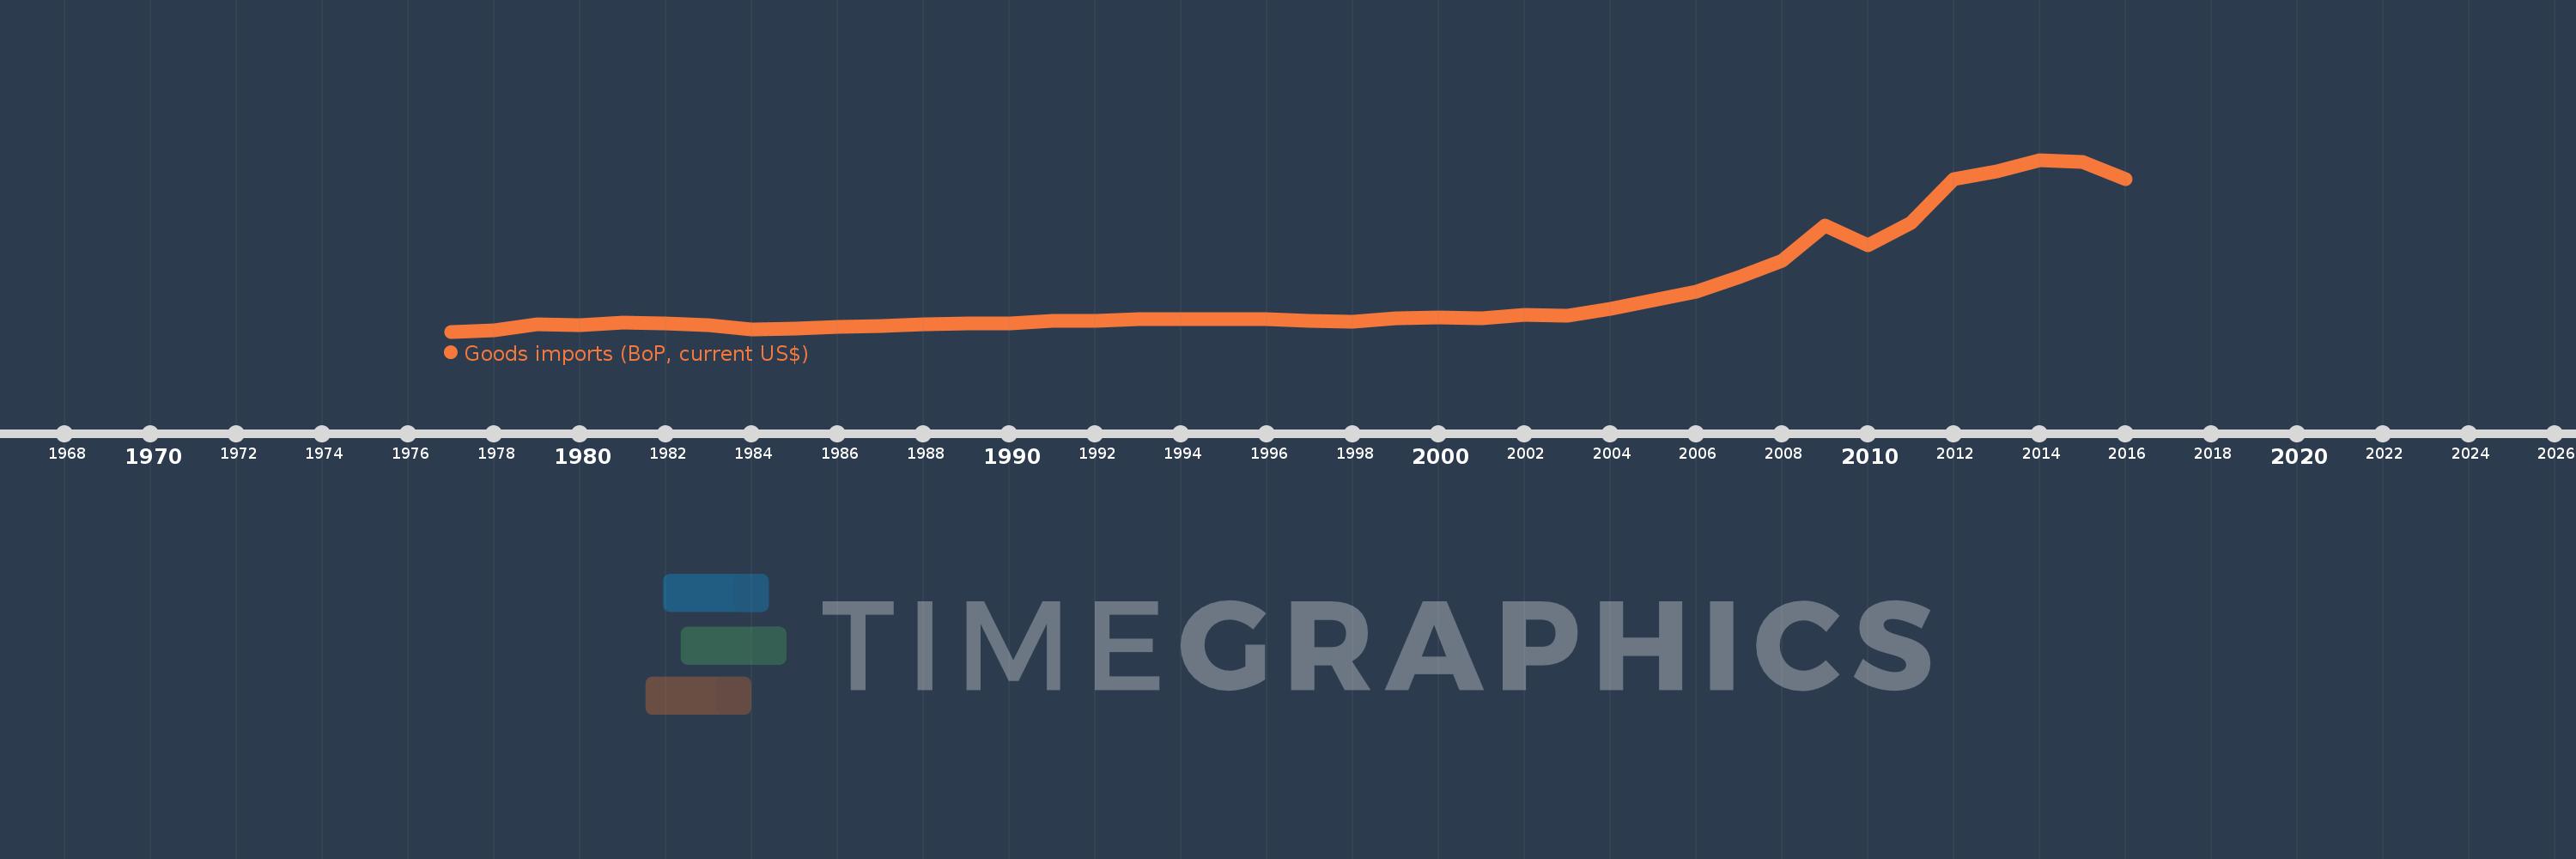
Goods imports (BoP, current US$)
2016,2015,2014,2013,2012,2011,2010,2009,2008,2007,2006,2005,2004,2003,2002,2001,2000,1999,1998,1997,1996,1995,1994,1993,1992,1991,1990,1989,1988,1987,1986,1985,1984,1983,1982,1981,1980,1979,1978,1977
This statistics in other country:
AfghanistanAlbaniaAlgeriaAngolaAntigua and BarbudaArab WorldArgentinaArmeniaArubaAustraliaAustriaAzerbaijanBahamas, TheBahrainBangladeshBarbadosBelarusBelgiumBelizeBeninBermudaBhutanBoliviaBosnia and HerzegovinaBotswanaBrazilBrunei DarussalamBulgariaBurkina FasoBurundiCabo VerdeCambodiaCameroonCanadaCaribbean small statesCentral African RepublicCentral Europe and the BalticsChadChileChinaColombiaComorosCongo, Dem. Rep.Congo, Rep.Costa RicaCote d'IvoireCroatiaCuracaoCyprusCzech RepublicDenmarkDjiboutiDominicaDominican RepublicEarly-demographic dividendEast Asia & PacificEast Asia & Pacific (excluding high income)East Asia & Pacific (IDA & IBRD countries)EcuadorEgypt, Arab Rep.El SalvadorEquatorial GuineaEritreaEstoniaEthiopiaEuro areaEurope & Central AsiaEurope & Central Asia (excluding high income)Europe & Central Asia (IDA & IBRD countries)European UnionFaroe IslandsFijiFinlandFragile and conflict affected situationsFranceFrench PolynesiaGabonGambia, TheGeorgiaGermanyGhanaGreeceGrenadaGuatemalaGuineaGuinea-BissauGuyanaHaitiHeavily indebted poor countries (HIPC)High incomeHondurasHong Kong SAR, ChinaHungaryIBRD onlyIcelandIDA & IBRD totalIDA blendIDA onlyIDA totalIndiaIndonesiaIran, Islamic Rep.IraqIrelandIsraelItalyJamaicaJapanJordanKazakhstanKenyaKiribatiKorea, Rep.KosovoKuwaitKyrgyz RepublicLao PDRLate-demographic dividendLatin America & Caribbean Latin America & Caribbean (excluding high income)Latin America & the Caribbean (IDA & IBRD countries)LatviaLeast developed countries: UN classificationLebanonLesothoLiberiaLibyaLithuaniaLow & middle incomeLow incomeLower middle incomeLuxembourgMacao SAR, ChinaMacedonia, FYRMadagascarMalawiMalaysiaMaldivesMaliMaltaMarshall IslandsMauritaniaMauritiusMexicoMicronesia, Fed. Sts.Middle East & North Africa (excluding high income)Middle East & North Africa (IDA & IBRD countries)Middle incomeMoldovaMongoliaMontenegroMoroccoMozambiqueMyanmarNamibiaNepalNetherlandsNew CaledoniaNew ZealandNicaraguaNigerNigeriaNorth AmericaNorwayOECD membersOmanOther small statesPacific island small statesPakistanPalauPanamaPapua New GuineaParaguayPeruPhilippinesPolandPortugalPost-demographic dividendPre-demographic dividendQatarRomaniaRussian FederationRwandaSamoaSao Tome and PrincipeSaudi ArabiaSenegalSerbiaSeychellesSierra LeoneSingaporeSint Maarten (Dutch part)Slovak RepublicSloveniaSmall statesSolomon IslandsSouth AfricaSouth AsiaSouth Asia (IDA & IBRD)South SudanSpainSri LankaSt. Kitts and NevisSt. LuciaSt. Vincent and the GrenadinesSub-Saharan Africa Sub-Saharan Africa (excluding high income)Sub-Saharan Africa (IDA & IBRD countries)SudanSurinameSwazilandSwedenSwitzerlandSyrian Arab RepublicTajikistanTanzaniaThailandTimor-LesteTogoTongaTrinidad and TobagoTunisiaTurkeyTuvaluUgandaUkraineUnited KingdomUnited StatesUpper middle incomeUruguayVanuatuVenezuela, RBVietnamWest Bank and GazaWorldYemen, Rep.ZambiaZimbabwe Timeline:
This timeline shows a graph from 1977 to 2016 of Tanzania. No data until 1976. Number of actual observations by date: 40.
Source name:
World Development Indicators
Source organization:
International Monetary Fund, Balance of Payments Statistics Yearbook and data files.
Categories, topics:
Economy & Growth, Trade
Last updated:
apr 23, 2017
Indicators value changes by year
Minimum:
555.703 mln
jan 1, 1977
Maximum:
11.029 bln
jan 1, 2014
At the date of observation
Value
Absolute change
Change from previous value
jan 1, 1977
555.703 mln
+555.703 mln
0.0%
jan 1, 1978
646.745 mln
+91.041 mln
16.38%
jan 1, 1979
992.473 mln
+345.728 mln
53.46%
jan 1, 1980
960.735 mln
-31.738 mln
-3.2%
jan 1, 1981
1.089 bln
+128.376 mln
13.36%
jan 1, 1982
1.061 bln
-27.846 mln
-2.56%
jan 1, 1983
951.997 mln
-109.268 mln
-10.3%
jan 1, 1984
708.441 mln
-243.556 mln
-25.58%
jan 1, 1985
760.254 mln
+51.814 mln
7.31%
jan 1, 1986
869.203 mln
+108.948 mln
14.33%
jan 1, 1987
913.328 mln
+44.125 mln
5.08%
jan 1, 1988
1.0 bln
+87.165 mln
9.54%
jan 1, 1989
1.033 bln
+32.48 mln
3.25%
jan 1, 1990
1.07 bln
+37.151 mln
3.6%
jan 1, 1991
1.186 bln
+116.203 mln
10.86%
jan 1, 1992
1.23 bln
+43.584 mln
3.67%
jan 1, 1993
1.335 bln
+105.253 mln
8.56%
jan 1, 1994
1.304 bln
-31.145 mln
-2.33%
jan 1, 1995
1.309 bln
+5.288 mln
0.41%
jan 1, 1996
1.34 bln
+30.694 mln
2.34%
jan 1, 1997
1.213 bln
-126.871 mln
-9.47%
jan 1, 1998
1.164 bln
-48.683 mln
-4.01%
jan 1, 1999
1.365 bln
+200.881 mln
17.25%
jan 1, 2000
1.415 bln
+50.074 mln
3.67%
jan 1, 2001
1.368 bln
-47.799 mln
-3.38%
jan 1, 2002
1.56 bln
+192.741 mln
14.09%
jan 1, 2003
1.511 bln
-49.019 mln
-3.14%
jan 1, 2004
1.933 bln
+422.138 mln
27.93%
jan 1, 2005
2.483 bln
+549.376 mln
28.41%
jan 1, 2006
2.998 bln
+514.731 mln
20.73%
jan 1, 2007
3.864 bln
+866.537 mln
28.91%
jan 1, 2008
4.861 bln
+996.529 mln
25.79%
jan 1, 2009
7.012 bln
+2.152 bln
44.27%
jan 1, 2010
5.834 bln
-1.178 bln
-16.8%
jan 1, 2011
7.166 bln
+1.331 bln
22.82%
jan 1, 2012
9.827 bln
+2.662 bln
37.15%
jan 1, 2013
10.319 bln
+491.651 mln
5.0%
jan 1, 2014
11.029 bln
+709.984 mln
6.88%
jan 1, 2015
10.918 bln
-111.321 mln
-1.01%
jan 1, 2016
9.843 bln
-1.075 bln
-9.84%
Ranking of countries by current statistics by years


Comments: