29
/
en
AIzaSyAYiBZKx7MnpbEhh9jyipgxe19OcubqV5w
April 1, 2024
110971
Congo, Rep.
COG
true
2
1
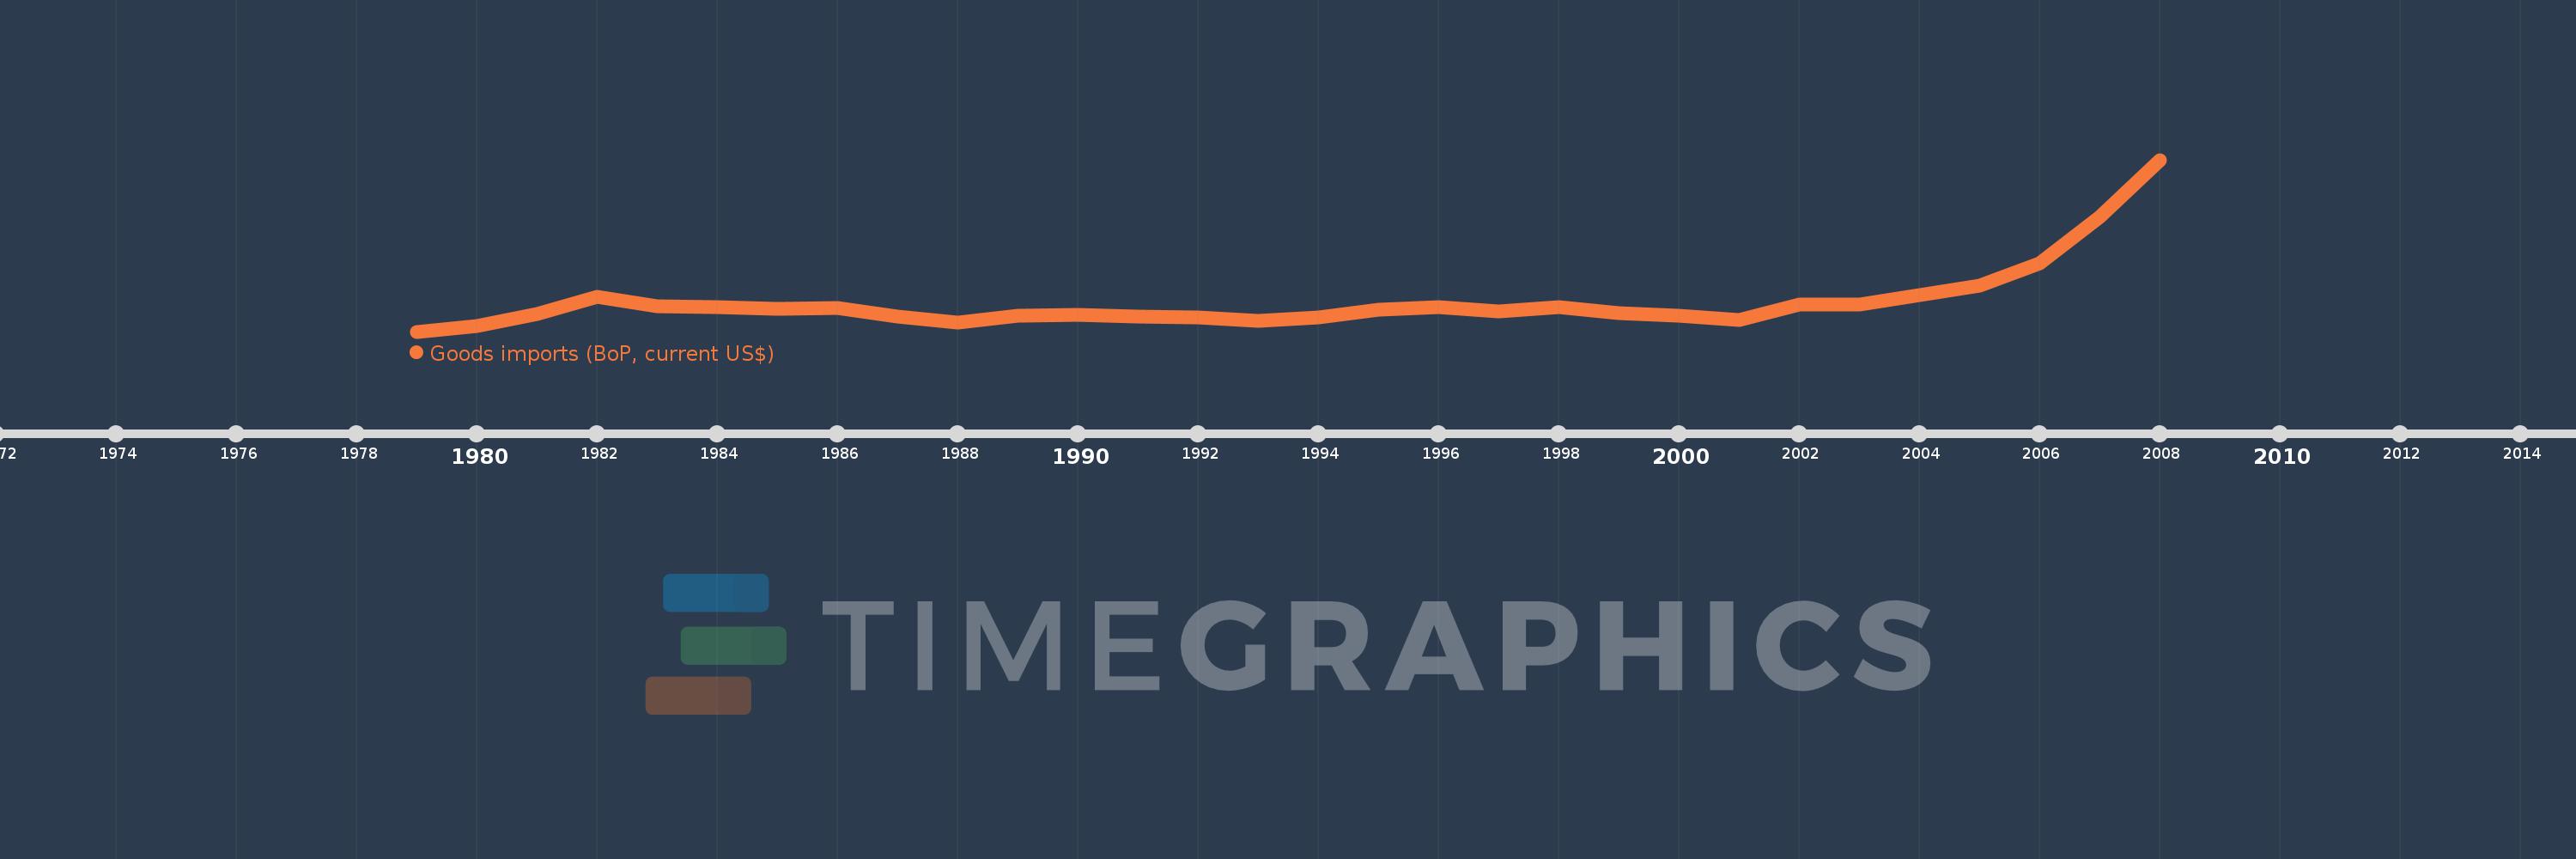
Goods imports (BoP, current US$)
2008,2007,2006,2005,2004,2003,2002,2001,2000,1999,1998,1997,1996,1995,1994,1993,1992,1991,1990,1989,1988,1987,1986,1985,1984,1983,1982,1981,1980,1979
This statistics in other country:
AfghanistanAlbaniaAlgeriaAngolaAntigua and BarbudaArab WorldArgentinaArmeniaArubaAustraliaAustriaAzerbaijanBahamas, TheBahrainBangladeshBarbadosBelarusBelgiumBelizeBeninBermudaBhutanBoliviaBosnia and HerzegovinaBotswanaBrazilBrunei DarussalamBulgariaBurkina FasoBurundiCabo VerdeCambodiaCameroonCanadaCaribbean small statesCentral African RepublicCentral Europe and the BalticsChadChileChinaColombiaComorosCongo, Dem. Rep.Congo, Rep.Costa RicaCote d'IvoireCroatiaCuracaoCyprusCzech RepublicDenmarkDjiboutiDominicaDominican RepublicEarly-demographic dividendEast Asia & PacificEast Asia & Pacific (excluding high income)East Asia & Pacific (IDA & IBRD countries)EcuadorEgypt, Arab Rep.El SalvadorEquatorial GuineaEritreaEstoniaEthiopiaEuro areaEurope & Central AsiaEurope & Central Asia (excluding high income)Europe & Central Asia (IDA & IBRD countries)European UnionFaroe IslandsFijiFinlandFragile and conflict affected situationsFranceFrench PolynesiaGabonGambia, TheGeorgiaGermanyGhanaGreeceGrenadaGuatemalaGuineaGuinea-BissauGuyanaHaitiHeavily indebted poor countries (HIPC)High incomeHondurasHong Kong SAR, ChinaHungaryIBRD onlyIcelandIDA & IBRD totalIDA blendIDA onlyIDA totalIndiaIndonesiaIran, Islamic Rep.IraqIrelandIsraelItalyJamaicaJapanJordanKazakhstanKenyaKiribatiKorea, Rep.KosovoKuwaitKyrgyz RepublicLao PDRLate-demographic dividendLatin America & Caribbean Latin America & Caribbean (excluding high income)Latin America & the Caribbean (IDA & IBRD countries)LatviaLeast developed countries: UN classificationLebanonLesothoLiberiaLibyaLithuaniaLow & middle incomeLow incomeLower middle incomeLuxembourgMacao SAR, ChinaMacedonia, FYRMadagascarMalawiMalaysiaMaldivesMaliMaltaMarshall IslandsMauritaniaMauritiusMexicoMicronesia, Fed. Sts.Middle East & North Africa (excluding high income)Middle East & North Africa (IDA & IBRD countries)Middle incomeMoldovaMongoliaMontenegroMoroccoMozambiqueMyanmarNamibiaNepalNetherlandsNew CaledoniaNew ZealandNicaraguaNigerNigeriaNorth AmericaNorwayOECD membersOmanOther small statesPacific island small statesPakistanPalauPanamaPapua New GuineaParaguayPeruPhilippinesPolandPortugalPost-demographic dividendPre-demographic dividendQatarRomaniaRussian FederationRwandaSamoaSao Tome and PrincipeSaudi ArabiaSenegalSerbiaSeychellesSierra LeoneSingaporeSint Maarten (Dutch part)Slovak RepublicSloveniaSmall statesSolomon IslandsSouth AfricaSouth AsiaSouth Asia (IDA & IBRD)South SudanSpainSri LankaSt. Kitts and NevisSt. LuciaSt. Vincent and the GrenadinesSub-Saharan Africa Sub-Saharan Africa (excluding high income)Sub-Saharan Africa (IDA & IBRD countries)SudanSurinameSwazilandSwedenSwitzerlandSyrian Arab RepublicTajikistanTanzaniaThailandTimor-LesteTogoTongaTrinidad and TobagoTunisiaTurkeyTuvaluUgandaUkraineUnited KingdomUnited StatesUpper middle incomeUruguayVanuatuVenezuela, RBVietnamWest Bank and GazaWorldYemen, Rep.ZambiaZimbabwe Timeline:
This timeline shows a graph from 1979 to 2008 of Congo, Rep.. No data until 1978. Number of actual observations by date: 30.
Source name:
World Development Indicators
Source organization:
International Monetary Fund, Balance of Payments Statistics Yearbook and data files.
Categories, topics:
Economy & Growth, Trade
Last updated:
apr 23, 2017
Indicators value changes by year
Minimum:
282.058 mln
jan 1, 1979
Maximum:
2.858 bln
jan 1, 2008
At the date of observation
Value
Absolute change
Change from previous value
jan 1, 1979
282.058 mln
+282.058 mln
0.0%
jan 1, 1980
362.958 mln
+80.9 mln
28.68%
jan 1, 1981
545.207 mln
+182.249 mln
50.21%
jan 1, 1982
803.595 mln
+258.388 mln
47.39%
jan 1, 1983
663.825 mln
-139.77 mln
-17.39%
jan 1, 1984
649.512 mln
-14.313 mln
-2.16%
jan 1, 1985
617.59 mln
-31.922 mln
-4.91%
jan 1, 1986
630.054 mln
+12.464 mln
2.02%
jan 1, 1987
512.414 mln
-117.64 mln
-18.67%
jan 1, 1988
419.912 mln
-92.502 mln
-18.05%
jan 1, 1989
522.723 mln
+102.81 mln
24.48%
jan 1, 1990
531.961 mln
+9.238 mln
1.77%
jan 1, 1991
512.736 mln
-19.225 mln
-3.61%
jan 1, 1992
494.493 mln
-18.243 mln
-3.56%
jan 1, 1993
438.246 mln
-56.248 mln
-11.37%
jan 1, 1994
500.066 mln
+61.821 mln
14.11%
jan 1, 1995
612.747 mln
+112.681 mln
22.53%
jan 1, 1996
654.168 mln
+41.421 mln
6.76%
jan 1, 1997
587.16 mln
-67.008 mln
-10.24%
jan 1, 1998
648.843 mln
+61.684 mln
10.51%
jan 1, 1999
558.434 mln
-90.41 mln
-13.93%
jan 1, 2000
522.651 mln
-35.782 mln
-6.41%
jan 1, 2001
455.276 mln
-67.375 mln
-12.89%
jan 1, 2002
681.348 mln
+226.071 mln
49.66%
jan 1, 2003
691.145 mln
+9.798 mln
1.44%
jan 1, 2004
831.211 mln
+140.066 mln
20.27%
jan 1, 2005
968.985 mln
+137.774 mln
16.58%
jan 1, 2006
1.305 bln
+336.497 mln
34.73%
jan 1, 2007
2.003 bln
+697.999 mln
53.47%
jan 1, 2008
2.858 bln
+854.636 mln
42.66%
Ranking of countries by current statistics by years


Comments: