29
/
en
AIzaSyAYiBZKx7MnpbEhh9jyipgxe19OcubqV5w
April 1, 2024
93601
Bulgaria
BGR
true
2
1
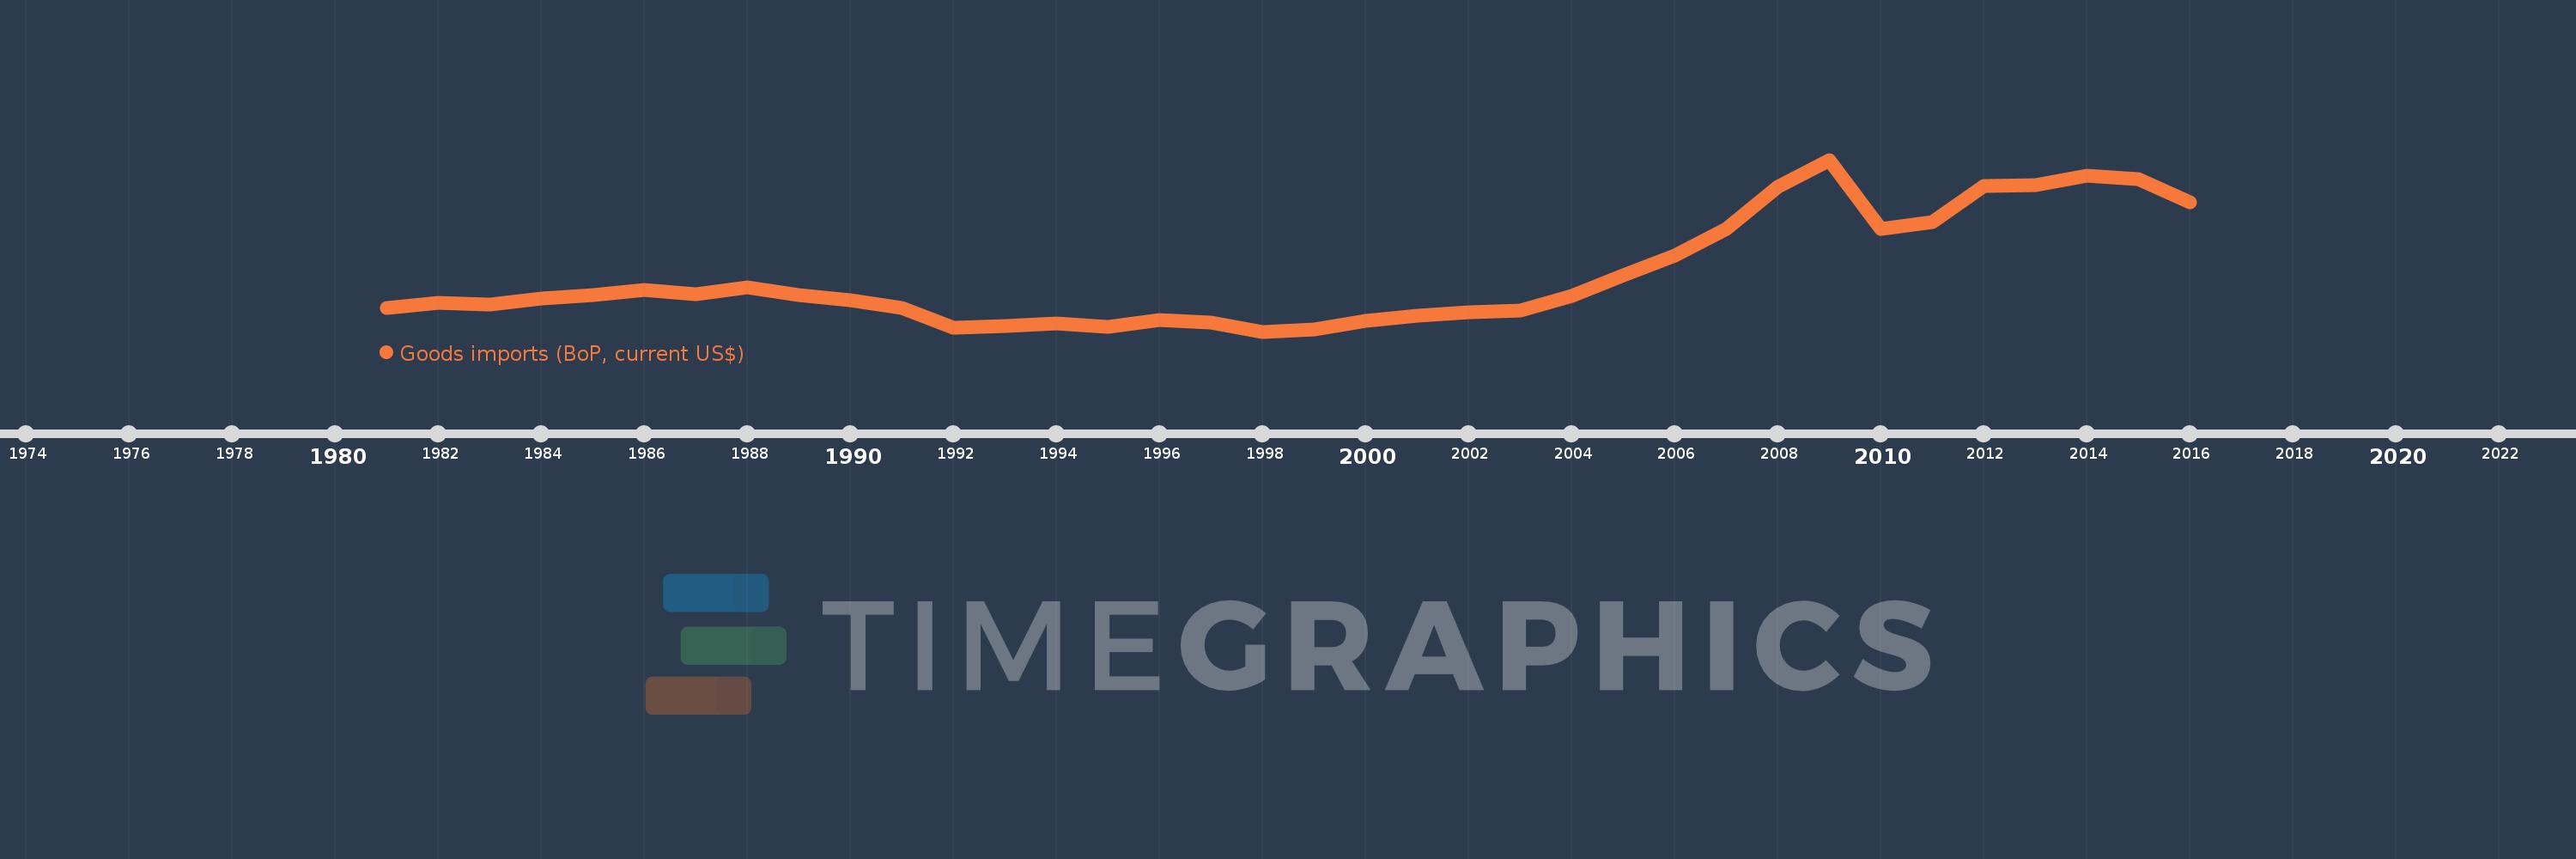
Goods imports (BoP, current US$)
2016,2015,2014,2013,2012,2011,2010,2009,2008,2007,2006,2005,2004,2003,2002,2001,2000,1999,1998,1997,1996,1995,1994,1993,1992,1991,1990,1989,1988,1987,1986,1985,1984,1983,1982,1981
This statistics in other country:
AfghanistanAlbaniaAlgeriaAngolaAntigua and BarbudaArab WorldArgentinaArmeniaArubaAustraliaAustriaAzerbaijanBahamas, TheBahrainBangladeshBarbadosBelarusBelgiumBelizeBeninBermudaBhutanBoliviaBosnia and HerzegovinaBotswanaBrazilBrunei DarussalamBulgariaBurkina FasoBurundiCabo VerdeCambodiaCameroonCanadaCaribbean small statesCentral African RepublicCentral Europe and the BalticsChadChileChinaColombiaComorosCongo, Dem. Rep.Congo, Rep.Costa RicaCote d'IvoireCroatiaCuracaoCyprusCzech RepublicDenmarkDjiboutiDominicaDominican RepublicEarly-demographic dividendEast Asia & PacificEast Asia & Pacific (excluding high income)East Asia & Pacific (IDA & IBRD countries)EcuadorEgypt, Arab Rep.El SalvadorEquatorial GuineaEritreaEstoniaEthiopiaEuro areaEurope & Central AsiaEurope & Central Asia (excluding high income)Europe & Central Asia (IDA & IBRD countries)European UnionFaroe IslandsFijiFinlandFragile and conflict affected situationsFranceFrench PolynesiaGabonGambia, TheGeorgiaGermanyGhanaGreeceGrenadaGuatemalaGuineaGuinea-BissauGuyanaHaitiHeavily indebted poor countries (HIPC)High incomeHondurasHong Kong SAR, ChinaHungaryIBRD onlyIcelandIDA & IBRD totalIDA blendIDA onlyIDA totalIndiaIndonesiaIran, Islamic Rep.IraqIrelandIsraelItalyJamaicaJapanJordanKazakhstanKenyaKiribatiKorea, Rep.KosovoKuwaitKyrgyz RepublicLao PDRLate-demographic dividendLatin America & Caribbean Latin America & Caribbean (excluding high income)Latin America & the Caribbean (IDA & IBRD countries)LatviaLeast developed countries: UN classificationLebanonLesothoLiberiaLibyaLithuaniaLow & middle incomeLow incomeLower middle incomeLuxembourgMacao SAR, ChinaMacedonia, FYRMadagascarMalawiMalaysiaMaldivesMaliMaltaMarshall IslandsMauritaniaMauritiusMexicoMicronesia, Fed. Sts.Middle East & North Africa (excluding high income)Middle East & North Africa (IDA & IBRD countries)Middle incomeMoldovaMongoliaMontenegroMoroccoMozambiqueMyanmarNamibiaNepalNetherlandsNew CaledoniaNew ZealandNicaraguaNigerNigeriaNorth AmericaNorwayOECD membersOmanOther small statesPacific island small statesPakistanPalauPanamaPapua New GuineaParaguayPeruPhilippinesPolandPortugalPost-demographic dividendPre-demographic dividendQatarRomaniaRussian FederationRwandaSamoaSao Tome and PrincipeSaudi ArabiaSenegalSerbiaSeychellesSierra LeoneSingaporeSint Maarten (Dutch part)Slovak RepublicSloveniaSmall statesSolomon IslandsSouth AfricaSouth AsiaSouth Asia (IDA & IBRD)South SudanSpainSri LankaSt. Kitts and NevisSt. LuciaSt. Vincent and the GrenadinesSub-Saharan Africa Sub-Saharan Africa (excluding high income)Sub-Saharan Africa (IDA & IBRD countries)SudanSurinameSwazilandSwedenSwitzerlandSyrian Arab RepublicTajikistanTanzaniaThailandTimor-LesteTogoTongaTrinidad and TobagoTunisiaTurkeyTuvaluUgandaUkraineUnited KingdomUnited StatesUpper middle incomeUruguayVanuatuVenezuela, RBVietnamWest Bank and GazaWorldYemen, Rep.ZambiaZimbabwe Timeline:
This timeline shows a graph from 1981 to 2016 of Bulgaria. No data until 1980. Number of actual observations by date: 36.
Source name:
World Development Indicators
Source organization:
International Monetary Fund, Balance of Payments Statistics Yearbook and data files.
Categories, topics:
Economy & Growth, Trade
Last updated:
apr 23, 2017
Indicators value changes by year
Minimum:
3.059 bln
jan 1, 1998
Maximum:
35.109 bln
jan 1, 2009
At the date of observation
Value
Absolute change
Change from previous value
jan 1, 1981
7.445 bln
+7.445 bln
0.0%
jan 1, 1982
8.36 bln
+915.0 mln
12.29%
jan 1, 1983
8.184 bln
-176.0 mln
-2.11%
jan 1, 1984
9.235 bln
+1.051 bln
12.84%
jan 1, 1985
9.849 bln
+614.0 mln
6.65%
jan 1, 1986
10.818 bln
+969.0 mln
9.84%
jan 1, 1987
10.045 bln
-773.0 mln
-7.15%
jan 1, 1988
11.308 bln
+1.263 bln
12.57%
jan 1, 1989
9.889 bln
-1.419 bln
-12.55%
jan 1, 1990
8.96 bln
-929.0 mln
-9.39%
jan 1, 1991
7.427 bln
-1.533 bln
-17.11%
jan 1, 1992
3.769 bln
-3.658 bln
-49.25%
jan 1, 1993
4.169 bln
+399.7 mln
10.6%
jan 1, 1994
4.612 bln
+443.2 mln
10.63%
jan 1, 1995
3.952 bln
-660.0 mln
-14.31%
jan 1, 1996
5.224 bln
+1.272 bln
32.19%
jan 1, 1997
4.703 bln
-521.4 mln
-9.98%
jan 1, 1998
3.059 bln
-1.643 bln
-34.95%
jan 1, 1999
3.421 bln
+362.273 mln
11.84%
jan 1, 2000
5.087 bln
+1.666 bln
48.69%
jan 1, 2001
6.0 bln
+912.768 mln
17.94%
jan 1, 2002
6.693 bln
+693.25 mln
11.55%
jan 1, 2003
7.013 bln
+319.183 mln
4.77%
jan 1, 2004
9.657 bln
+2.645 bln
37.71%
jan 1, 2005
13.619 bln
+3.962 bln
41.02%
jan 1, 2006
17.204 bln
+3.585 bln
26.33%
jan 1, 2007
22.13 bln
+4.925 bln
28.63%
jan 1, 2008
30.041 bln
+7.911 bln
35.75%
jan 1, 2009
35.109 bln
+5.068 bln
16.87%
jan 1, 2010
22.153 bln
-12.955 bln
-36.9%
jan 1, 2011
23.521 bln
+1.367 bln
6.17%
jan 1, 2012
30.293 bln
+6.773 bln
28.79%
jan 1, 2013
30.408 bln
+114.28 mln
0.38%
jan 1, 2014
32.07 bln
+1.662 bln
5.47%
jan 1, 2015
31.578 bln
-492.09 mln
-1.53%
jan 1, 2016
27.206 bln
-4.372 bln
-13.84%
Ranking of countries by current statistics by years


Comments: