29
/
en
AIzaSyAYiBZKx7MnpbEhh9jyipgxe19OcubqV5w
April 1, 2024
59812
Sub-Saharan Africa (excluding high income)
SSA
false
2
1
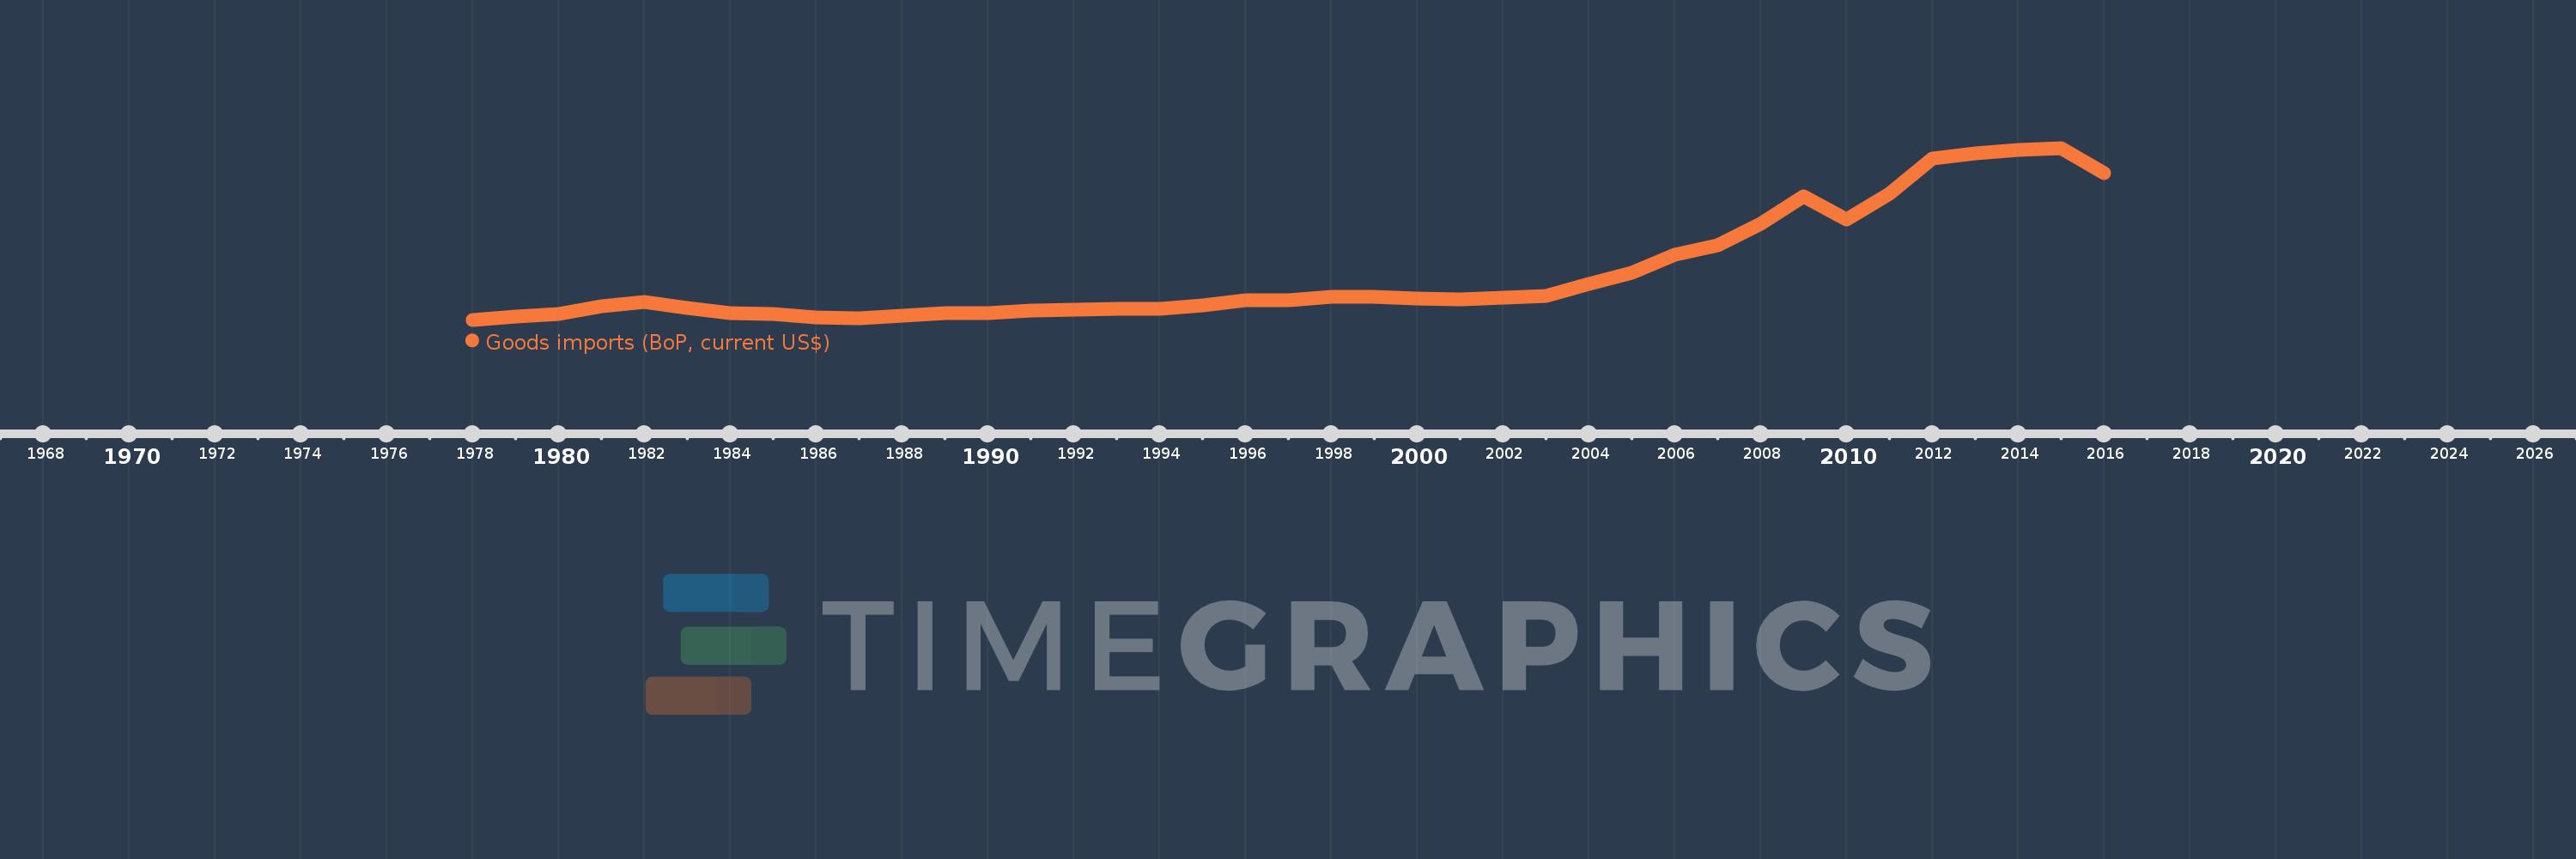
Goods imports (BoP, current US$)
2016,2015,2014,2013,2012,2011,2010,2009,2008,2007,2006,2005,2004,2003,2002,2001,2000,1999,1998,1997,1996,1995,1994,1993,1992,1991,1990,1989,1988,1987,1986,1985,1984,1983,1982,1981,1980,1979,1978
This statistics in other country:
AfghanistanAlbaniaAlgeriaAngolaAntigua and BarbudaArab WorldArgentinaArmeniaArubaAustraliaAustriaAzerbaijanBahamas, TheBahrainBangladeshBarbadosBelarusBelgiumBelizeBeninBermudaBhutanBoliviaBosnia and HerzegovinaBotswanaBrazilBrunei DarussalamBulgariaBurkina FasoBurundiCabo VerdeCambodiaCameroonCanadaCaribbean small statesCentral African RepublicCentral Europe and the BalticsChadChileChinaColombiaComorosCongo, Dem. Rep.Congo, Rep.Costa RicaCote d'IvoireCroatiaCuracaoCyprusCzech RepublicDenmarkDjiboutiDominicaDominican RepublicEarly-demographic dividendEast Asia & PacificEast Asia & Pacific (excluding high income)East Asia & Pacific (IDA & IBRD countries)EcuadorEgypt, Arab Rep.El SalvadorEquatorial GuineaEritreaEstoniaEthiopiaEuro areaEurope & Central AsiaEurope & Central Asia (excluding high income)Europe & Central Asia (IDA & IBRD countries)European UnionFaroe IslandsFijiFinlandFragile and conflict affected situationsFranceFrench PolynesiaGabonGambia, TheGeorgiaGermanyGhanaGreeceGrenadaGuatemalaGuineaGuinea-BissauGuyanaHaitiHeavily indebted poor countries (HIPC)High incomeHondurasHong Kong SAR, ChinaHungaryIBRD onlyIcelandIDA & IBRD totalIDA blendIDA onlyIDA totalIndiaIndonesiaIran, Islamic Rep.IraqIrelandIsraelItalyJamaicaJapanJordanKazakhstanKenyaKiribatiKorea, Rep.KosovoKuwaitKyrgyz RepublicLao PDRLate-demographic dividendLatin America & Caribbean Latin America & Caribbean (excluding high income)Latin America & the Caribbean (IDA & IBRD countries)LatviaLeast developed countries: UN classificationLebanonLesothoLiberiaLibyaLithuaniaLow & middle incomeLow incomeLower middle incomeLuxembourgMacao SAR, ChinaMacedonia, FYRMadagascarMalawiMalaysiaMaldivesMaliMaltaMarshall IslandsMauritaniaMauritiusMexicoMicronesia, Fed. Sts.Middle East & North Africa (excluding high income)Middle East & North Africa (IDA & IBRD countries)Middle incomeMoldovaMongoliaMontenegroMoroccoMozambiqueMyanmarNamibiaNepalNetherlandsNew CaledoniaNew ZealandNicaraguaNigerNigeriaNorth AmericaNorwayOECD membersOmanOther small statesPacific island small statesPakistanPalauPanamaPapua New GuineaParaguayPeruPhilippinesPolandPortugalPost-demographic dividendPre-demographic dividendQatarRomaniaRussian FederationRwandaSamoaSao Tome and PrincipeSaudi ArabiaSenegalSerbiaSeychellesSierra LeoneSingaporeSint Maarten (Dutch part)Slovak RepublicSloveniaSmall statesSolomon IslandsSouth AfricaSouth AsiaSouth Asia (IDA & IBRD)South SudanSpainSri LankaSt. Kitts and NevisSt. LuciaSt. Vincent and the GrenadinesSub-Saharan Africa Sub-Saharan Africa (excluding high income)Sub-Saharan Africa (IDA & IBRD countries)SudanSurinameSwazilandSwedenSwitzerlandSyrian Arab RepublicTajikistanTanzaniaThailandTimor-LesteTogoTongaTrinidad and TobagoTunisiaTurkeyTuvaluUgandaUkraineUnited KingdomUnited StatesUpper middle incomeUruguayVanuatuVenezuela, RBVietnamWest Bank and GazaWorldYemen, Rep.ZambiaZimbabwe Timeline:
This timeline shows a graph from 1978 to 2016 of Sub-Saharan Africa (excluding high income). No data until 1977. Number of actual observations by date: 39.
Source name:
World Development Indicators
Source organization:
International Monetary Fund, Balance of Payments Statistics Yearbook and data files.
Categories, topics:
Economy & Growth, Trade
Last updated:
apr 23, 2017
Indicators value changes by year
Minimum:
33.91 bln
jan 1, 1978
Maximum:
392.723 bln
jan 1, 2015
At the date of observation
Value
Absolute change
Change from previous value
jan 1, 1978
33.91 bln
+33.91 bln
0.0%
jan 1, 1979
40.6 bln
+6.69 bln
19.73%
jan 1, 1980
46.232 bln
+5.632 bln
13.87%
jan 1, 1981
62.864 bln
+16.632 bln
35.98%
jan 1, 1982
70.897 bln
+8.033 bln
12.78%
jan 1, 1983
57.673 bln
-13.225 bln
-18.65%
jan 1, 1984
48.283 bln
-9.39 bln
-16.28%
jan 1, 1985
45.068 bln
-3.215 bln
-6.66%
jan 1, 1986
38.512 bln
-6.556 bln
-14.55%
jan 1, 1987
36.219 bln
-2.293 bln
-5.95%
jan 1, 1988
41.964 bln
+5.745 bln
15.86%
jan 1, 1989
47.806 bln
+5.841 bln
13.92%
jan 1, 1990
47.167 bln
-639.007 mln
-1.34%
jan 1, 1991
52.438 bln
+5.272 bln
11.18%
jan 1, 1992
54.61 bln
+2.171 bln
4.14%
jan 1, 1993
56.725 bln
+2.116 bln
3.87%
jan 1, 1994
57.058 bln
+332.765 mln
0.59%
jan 1, 1995
63.151 bln
+6.093 bln
10.68%
jan 1, 1996
73.987 bln
+10.836 bln
17.16%
jan 1, 1997
73.927 bln
-59.912 mln
-0.08%
jan 1, 1998
81.861 bln
+7.934 bln
10.73%
jan 1, 1999
82.155 bln
+293.678 mln
0.36%
jan 1, 2000
78.591 bln
-3.563 bln
-4.34%
jan 1, 2001
75.955 bln
-2.637 bln
-3.35%
jan 1, 2002
79.767 bln
+3.812 bln
5.02%
jan 1, 2003
83.188 bln
+3.422 bln
4.29%
jan 1, 2004
108.104 bln
+24.916 bln
29.95%
jan 1, 2005
132.509 bln
+24.405 bln
22.58%
jan 1, 2006
169.072 bln
+36.563 bln
27.59%
jan 1, 2007
189.911 bln
+20.839 bln
12.33%
jan 1, 2008
234.825 bln
+44.914 bln
23.65%
jan 1, 2009
292.555 bln
+57.73 bln
24.58%
jan 1, 2010
244.165 bln
-48.39 bln
-16.54%
jan 1, 2011
297.631 bln
+53.466 bln
21.9%
jan 1, 2012
370.853 bln
+73.222 bln
24.6%
jan 1, 2013
381.209 bln
+10.356 bln
2.79%
jan 1, 2014
389.403 bln
+8.194 bln
2.15%
jan 1, 2015
392.723 bln
+3.321 bln
0.85%
jan 1, 2016
339.957 bln
-52.767 bln
-13.44%
Ranking of countries by current statistics by years


Comments: