29
/
en
AIzaSyAYiBZKx7MnpbEhh9jyipgxe19OcubqV5w
April 1, 2024
194261
Mauritius
MUS
true
2
1
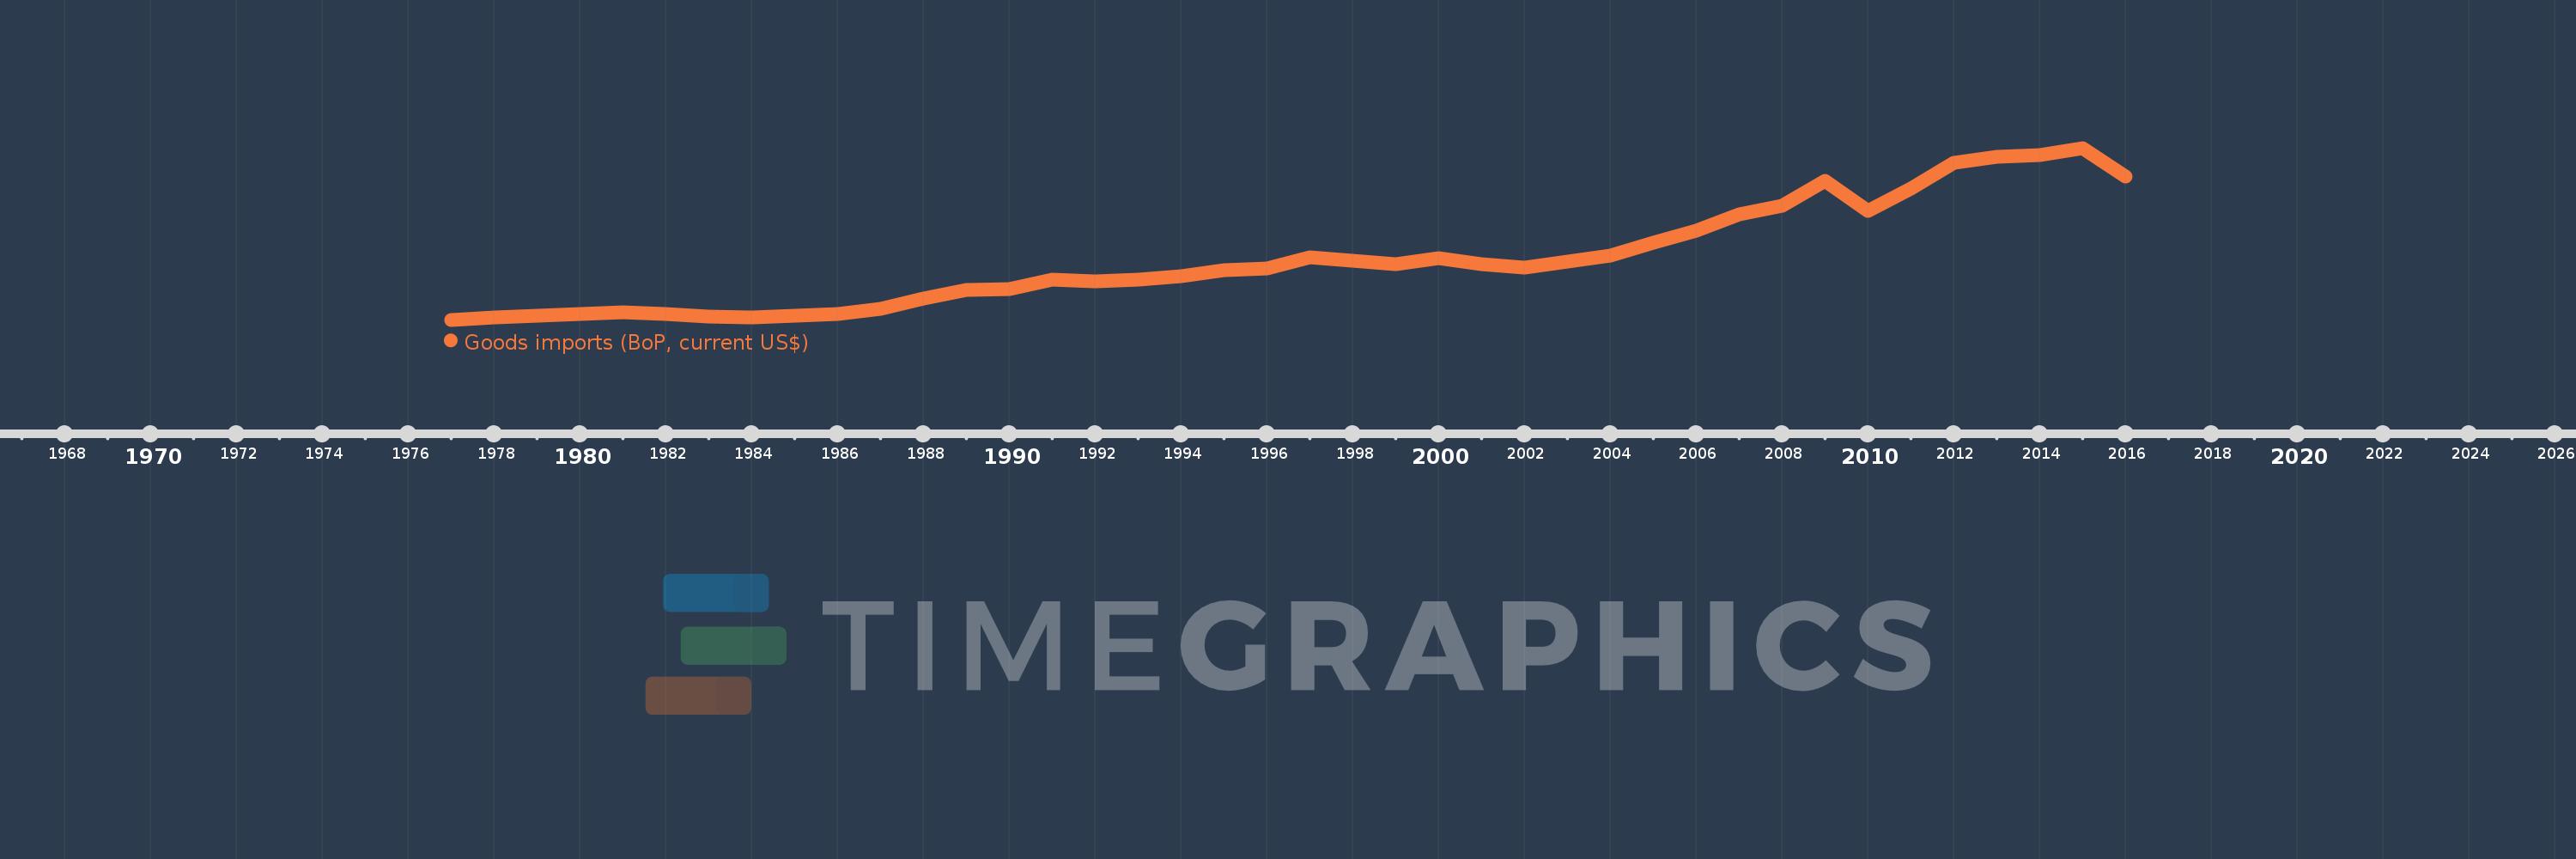
Goods imports (BoP, current US$)
2016,2015,2014,2013,2012,2011,2010,2009,2008,2007,2006,2005,2004,2003,2002,2001,2000,1999,1998,1997,1996,1995,1994,1993,1992,1991,1990,1989,1988,1987,1986,1985,1984,1983,1982,1981,1980,1979,1978,1977
This statistics in other country:
AfghanistanAlbaniaAlgeriaAngolaAntigua and BarbudaArab WorldArgentinaArmeniaArubaAustraliaAustriaAzerbaijanBahamas, TheBahrainBangladeshBarbadosBelarusBelgiumBelizeBeninBermudaBhutanBoliviaBosnia and HerzegovinaBotswanaBrazilBrunei DarussalamBulgariaBurkina FasoBurundiCabo VerdeCambodiaCameroonCanadaCaribbean small statesCentral African RepublicCentral Europe and the BalticsChadChileChinaColombiaComorosCongo, Dem. Rep.Congo, Rep.Costa RicaCote d'IvoireCroatiaCuracaoCyprusCzech RepublicDenmarkDjiboutiDominicaDominican RepublicEarly-demographic dividendEast Asia & PacificEast Asia & Pacific (excluding high income)East Asia & Pacific (IDA & IBRD countries)EcuadorEgypt, Arab Rep.El SalvadorEquatorial GuineaEritreaEstoniaEthiopiaEuro areaEurope & Central AsiaEurope & Central Asia (excluding high income)Europe & Central Asia (IDA & IBRD countries)European UnionFaroe IslandsFijiFinlandFragile and conflict affected situationsFranceFrench PolynesiaGabonGambia, TheGeorgiaGermanyGhanaGreeceGrenadaGuatemalaGuineaGuinea-BissauGuyanaHaitiHeavily indebted poor countries (HIPC)High incomeHondurasHong Kong SAR, ChinaHungaryIBRD onlyIcelandIDA & IBRD totalIDA blendIDA onlyIDA totalIndiaIndonesiaIran, Islamic Rep.IraqIrelandIsraelItalyJamaicaJapanJordanKazakhstanKenyaKiribatiKorea, Rep.KosovoKuwaitKyrgyz RepublicLao PDRLate-demographic dividendLatin America & Caribbean Latin America & Caribbean (excluding high income)Latin America & the Caribbean (IDA & IBRD countries)LatviaLeast developed countries: UN classificationLebanonLesothoLiberiaLibyaLithuaniaLow & middle incomeLow incomeLower middle incomeLuxembourgMacao SAR, ChinaMacedonia, FYRMadagascarMalawiMalaysiaMaldivesMaliMaltaMarshall IslandsMauritaniaMauritiusMexicoMicronesia, Fed. Sts.Middle East & North Africa (excluding high income)Middle East & North Africa (IDA & IBRD countries)Middle incomeMoldovaMongoliaMontenegroMoroccoMozambiqueMyanmarNamibiaNepalNetherlandsNew CaledoniaNew ZealandNicaraguaNigerNigeriaNorth AmericaNorwayOECD membersOmanOther small statesPacific island small statesPakistanPalauPanamaPapua New GuineaParaguayPeruPhilippinesPolandPortugalPost-demographic dividendPre-demographic dividendQatarRomaniaRussian FederationRwandaSamoaSao Tome and PrincipeSaudi ArabiaSenegalSerbiaSeychellesSierra LeoneSingaporeSint Maarten (Dutch part)Slovak RepublicSloveniaSmall statesSolomon IslandsSouth AfricaSouth AsiaSouth Asia (IDA & IBRD)South SudanSpainSri LankaSt. Kitts and NevisSt. LuciaSt. Vincent and the GrenadinesSub-Saharan Africa Sub-Saharan Africa (excluding high income)Sub-Saharan Africa (IDA & IBRD countries)SudanSurinameSwazilandSwedenSwitzerlandSyrian Arab RepublicTajikistanTanzaniaThailandTimor-LesteTogoTongaTrinidad and TobagoTunisiaTurkeyTuvaluUgandaUkraineUnited KingdomUnited StatesUpper middle incomeUruguayVanuatuVenezuela, RBVietnamWest Bank and GazaWorldYemen, Rep.ZambiaZimbabwe Timeline:
This timeline shows a graph from 1977 to 2016 of Mauritius. No data until 1976. Number of actual observations by date: 40.
Source name:
World Development Indicators
Source organization:
International Monetary Fund, Balance of Payments Statistics Yearbook and data files.
Categories, topics:
Economy & Growth, Trade
Last updated:
apr 23, 2017
Indicators value changes by year
Minimum:
307.415 mln
jan 1, 1977
Maximum:
5.354 bln
jan 1, 2015
At the date of observation
Value
Absolute change
Change from previous value
jan 1, 1977
307.415 mln
+307.415 mln
0.0%
jan 1, 1978
367.775 mln
+60.36 mln
19.63%
jan 1, 1979
418.446 mln
+50.672 mln
13.78%
jan 1, 1980
484.297 mln
+65.851 mln
15.74%
jan 1, 1981
515.858 mln
+31.56 mln
6.52%
jan 1, 1982
475.911 mln
-39.946 mln
-7.74%
jan 1, 1983
396.687 mln
-79.224 mln
-16.65%
jan 1, 1984
385.778 mln
-10.909 mln
-2.75%
jan 1, 1985
414.99 mln
+29.211 mln
7.57%
jan 1, 1986
465.275 mln
+50.285 mln
12.12%
jan 1, 1987
622.069 mln
+156.794 mln
33.7%
jan 1, 1988
925.439 mln
+303.37 mln
48.77%
jan 1, 1989
1.178 bln
+252.365 mln
27.27%
jan 1, 1990
1.218 bln
+39.854 mln
3.38%
jan 1, 1991
1.495 bln
+277.148 mln
22.76%
jan 1, 1992
1.439 bln
-56.296 mln
-3.77%
jan 1, 1993
1.494 bln
+55.398 mln
3.85%
jan 1, 1994
1.576 bln
+82.132 mln
5.5%
jan 1, 1995
1.774 bln
+197.865 mln
12.55%
jan 1, 1996
1.812 bln
+38.324 mln
2.16%
jan 1, 1997
2.136 bln
+324.045 mln
17.88%
jan 1, 1998
2.036 bln
-100.16 mln
-4.69%
jan 1, 1999
1.933 bln
-102.773 mln
-5.05%
jan 1, 2000
2.108 bln
+174.512 mln
9.03%
jan 1, 2001
1.944 bln
-163.497 mln
-7.76%
jan 1, 2002
1.846 bln
-98.387 mln
-5.06%
jan 1, 2003
2.013 bln
+166.592 mln
9.02%
jan 1, 2004
2.201 bln
+188.51 mln
9.37%
jan 1, 2005
2.573 bln
+371.513 mln
16.88%
jan 1, 2006
2.935 bln
+362.615 mln
14.1%
jan 1, 2007
3.409 bln
+473.615 mln
16.14%
jan 1, 2008
3.656 bln
+246.841 mln
7.24%
jan 1, 2009
4.386 bln
+730.337 mln
19.98%
jan 1, 2010
3.504 bln
-882.066 mln
-20.11%
jan 1, 2011
4.157 bln
+652.814 mln
18.63%
jan 1, 2012
4.917 bln
+760.622 mln
18.3%
jan 1, 2013
5.105 bln
+187.409 mln
3.81%
jan 1, 2014
5.139 bln
+34.276 mln
0.67%
jan 1, 2015
5.354 bln
+214.848 mln
4.18%
jan 1, 2016
4.526 bln
-828.319 mln
-15.47%
Ranking of countries by current statistics by years


Comments: