29
/
en
AIzaSyAYiBZKx7MnpbEhh9jyipgxe19OcubqV5w
April 1, 2024
262279
Thailand
THA
true
2
1
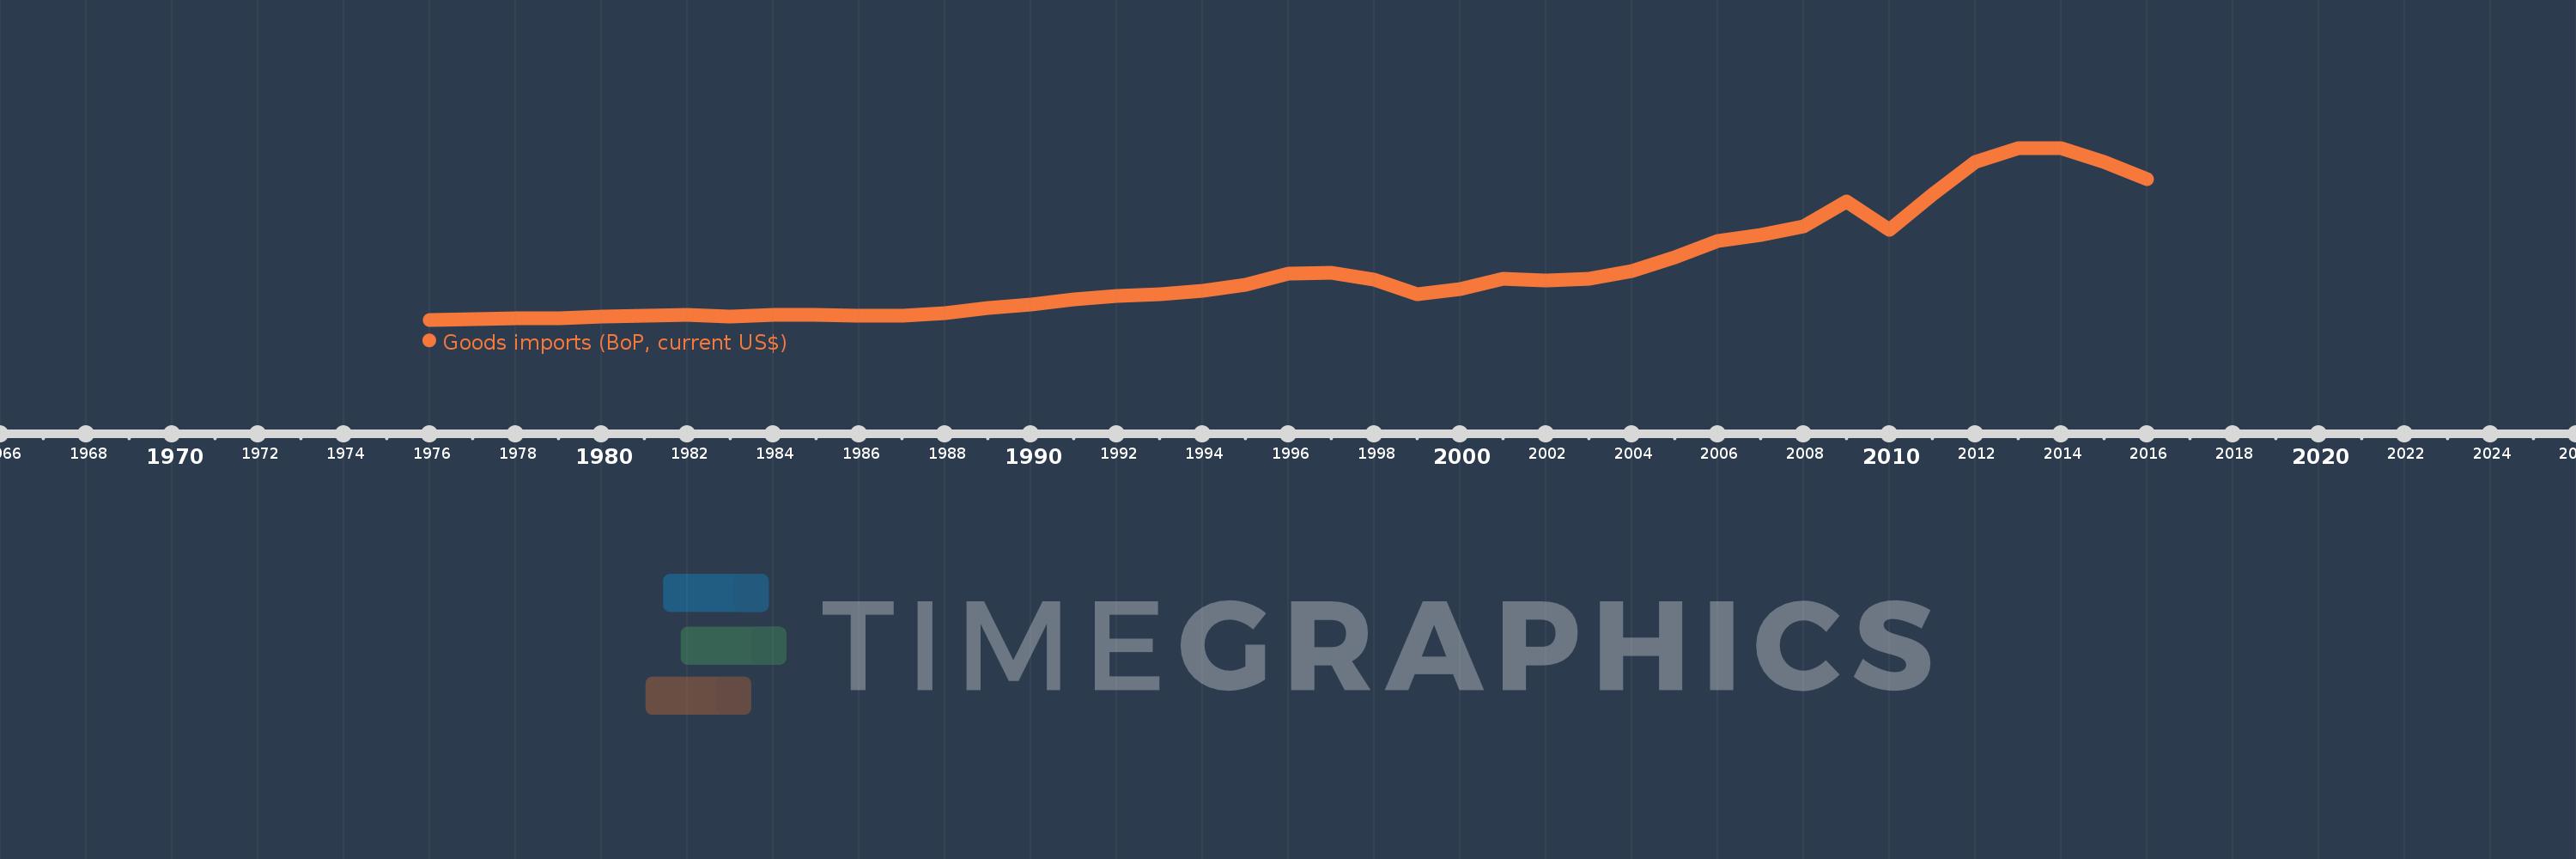
Goods imports (BoP, current US$)
2016,2015,2014,2013,2012,2011,2010,2009,2008,2007,2006,2005,2004,2003,2002,2001,2000,1999,1998,1997,1996,1995,1994,1993,1992,1991,1990,1989,1988,1987,1986,1985,1984,1983,1982,1981,1980,1979,1978,1977,1976
This statistics in other country:
AfghanistanAlbaniaAlgeriaAngolaAntigua and BarbudaArab WorldArgentinaArmeniaArubaAustraliaAustriaAzerbaijanBahamas, TheBahrainBangladeshBarbadosBelarusBelgiumBelizeBeninBermudaBhutanBoliviaBosnia and HerzegovinaBotswanaBrazilBrunei DarussalamBulgariaBurkina FasoBurundiCabo VerdeCambodiaCameroonCanadaCaribbean small statesCentral African RepublicCentral Europe and the BalticsChadChileChinaColombiaComorosCongo, Dem. Rep.Congo, Rep.Costa RicaCote d'IvoireCroatiaCuracaoCyprusCzech RepublicDenmarkDjiboutiDominicaDominican RepublicEarly-demographic dividendEast Asia & PacificEast Asia & Pacific (excluding high income)East Asia & Pacific (IDA & IBRD countries)EcuadorEgypt, Arab Rep.El SalvadorEquatorial GuineaEritreaEstoniaEthiopiaEuro areaEurope & Central AsiaEurope & Central Asia (excluding high income)Europe & Central Asia (IDA & IBRD countries)European UnionFaroe IslandsFijiFinlandFragile and conflict affected situationsFranceFrench PolynesiaGabonGambia, TheGeorgiaGermanyGhanaGreeceGrenadaGuatemalaGuineaGuinea-BissauGuyanaHaitiHeavily indebted poor countries (HIPC)High incomeHondurasHong Kong SAR, ChinaHungaryIBRD onlyIcelandIDA & IBRD totalIDA blendIDA onlyIDA totalIndiaIndonesiaIran, Islamic Rep.IraqIrelandIsraelItalyJamaicaJapanJordanKazakhstanKenyaKiribatiKorea, Rep.KosovoKuwaitKyrgyz RepublicLao PDRLate-demographic dividendLatin America & Caribbean Latin America & Caribbean (excluding high income)Latin America & the Caribbean (IDA & IBRD countries)LatviaLeast developed countries: UN classificationLebanonLesothoLiberiaLibyaLithuaniaLow & middle incomeLow incomeLower middle incomeLuxembourgMacao SAR, ChinaMacedonia, FYRMadagascarMalawiMalaysiaMaldivesMaliMaltaMarshall IslandsMauritaniaMauritiusMexicoMicronesia, Fed. Sts.Middle East & North Africa (excluding high income)Middle East & North Africa (IDA & IBRD countries)Middle incomeMoldovaMongoliaMontenegroMoroccoMozambiqueMyanmarNamibiaNepalNetherlandsNew CaledoniaNew ZealandNicaraguaNigerNigeriaNorth AmericaNorwayOECD membersOmanOther small statesPacific island small statesPakistanPalauPanamaPapua New GuineaParaguayPeruPhilippinesPolandPortugalPost-demographic dividendPre-demographic dividendQatarRomaniaRussian FederationRwandaSamoaSao Tome and PrincipeSaudi ArabiaSenegalSerbiaSeychellesSierra LeoneSingaporeSint Maarten (Dutch part)Slovak RepublicSloveniaSmall statesSolomon IslandsSouth AfricaSouth AsiaSouth Asia (IDA & IBRD)South SudanSpainSri LankaSt. Kitts and NevisSt. LuciaSt. Vincent and the GrenadinesSub-Saharan Africa Sub-Saharan Africa (excluding high income)Sub-Saharan Africa (IDA & IBRD countries)SudanSurinameSwazilandSwedenSwitzerlandSyrian Arab RepublicTajikistanTanzaniaThailandTimor-LesteTogoTongaTrinidad and TobagoTunisiaTurkeyTuvaluUgandaUkraineUnited KingdomUnited StatesUpper middle incomeUruguayVanuatuVenezuela, RBVietnamWest Bank and GazaWorldYemen, Rep.ZambiaZimbabwe Timeline:
This timeline shows a graph from 1976 to 2016 of Thailand. No data until 1975. Number of actual observations by date: 41.
Source name:
World Development Indicators
Source organization:
International Monetary Fund, Balance of Payments Statistics Yearbook and data files.
Categories, topics:
Economy & Growth, Trade
Last updated:
apr 23, 2017
Indicators value changes by year
Minimum:
2.85 bln
jan 1, 1976
Maximum:
227.625 bln
jan 1, 2013
At the date of observation
Value
Absolute change
Change from previous value
jan 1, 1976
2.85 bln
+2.85 bln
0.0%
jan 1, 1977
3.152 bln
+302.333 mln
10.61%
jan 1, 1978
4.238 bln
+1.086 bln
34.46%
jan 1, 1979
4.904 bln
+665.535 mln
15.7%
jan 1, 1980
6.785 bln
+1.881 bln
38.36%
jan 1, 1981
8.352 bln
+1.567 bln
23.09%
jan 1, 1982
8.93 bln
+578.914 mln
6.93%
jan 1, 1983
7.565 bln
-1.365 bln
-15.28%
jan 1, 1984
9.169 bln
+1.603 bln
21.19%
jan 1, 1985
9.236 bln
+66.992 mln
0.73%
jan 1, 1986
8.391 bln
-844.576 mln
-9.14%
jan 1, 1987
8.415 bln
+23.63 mln
0.28%
jan 1, 1988
12.019 bln
+3.604 bln
42.83%
jan 1, 1989
17.856 bln
+5.836 bln
48.56%
jan 1, 1990
22.75 bln
+4.894 bln
27.41%
jan 1, 1991
29.561 bln
+6.812 bln
29.94%
jan 1, 1992
34.221 bln
+4.66 bln
15.76%
jan 1, 1993
36.26 bln
+2.039 bln
5.96%
jan 1, 1994
40.694 bln
+4.434 bln
12.23%
jan 1, 1995
48.204 bln
+7.51 bln
18.45%
jan 1, 1996
63.415 bln
+15.211 bln
31.55%
jan 1, 1997
63.897 bln
+481.839 mln
0.76%
jan 1, 1998
55.084 bln
-8.812 bln
-13.79%
jan 1, 1999
36.515 bln
-18.569 bln
-33.71%
jan 1, 2000
42.762 bln
+6.247 bln
17.11%
jan 1, 2001
56.193 bln
+13.431 bln
31.41%
jan 1, 2002
54.539 bln
-1.654 bln
-2.94%
jan 1, 2003
57.008 bln
+2.469 bln
4.53%
jan 1, 2004
66.909 bln
+9.901 bln
17.37%
jan 1, 2005
84.193 bln
+17.285 bln
25.83%
jan 1, 2006
105.96 bln
+21.767 bln
25.85%
jan 1, 2007
114.272 bln
+8.312 bln
7.84%
jan 1, 2008
124.618 bln
+10.346 bln
9.05%
jan 1, 2009
157.885 bln
+33.267 bln
26.7%
jan 1, 2010
120.562 bln
-37.323 bln
-23.64%
jan 1, 2011
166.225 bln
+45.664 bln
37.88%
jan 1, 2012
209.213 bln
+42.988 bln
25.86%
jan 1, 2013
227.625 bln
+18.412 bln
8.8%
jan 1, 2014
227.407 bln
-218.31 mln
-0.1%
jan 1, 2015
209.422 bln
-17.985 bln
-7.91%
jan 1, 2016
187.248 bln
-22.175 bln
-10.59%
Ranking of countries by current statistics by years


Comments: