29
/
en
AIzaSyAYiBZKx7MnpbEhh9jyipgxe19OcubqV5w
April 1, 2024
251919
St. Vincent and the Grenadines
VCT
true
2
1
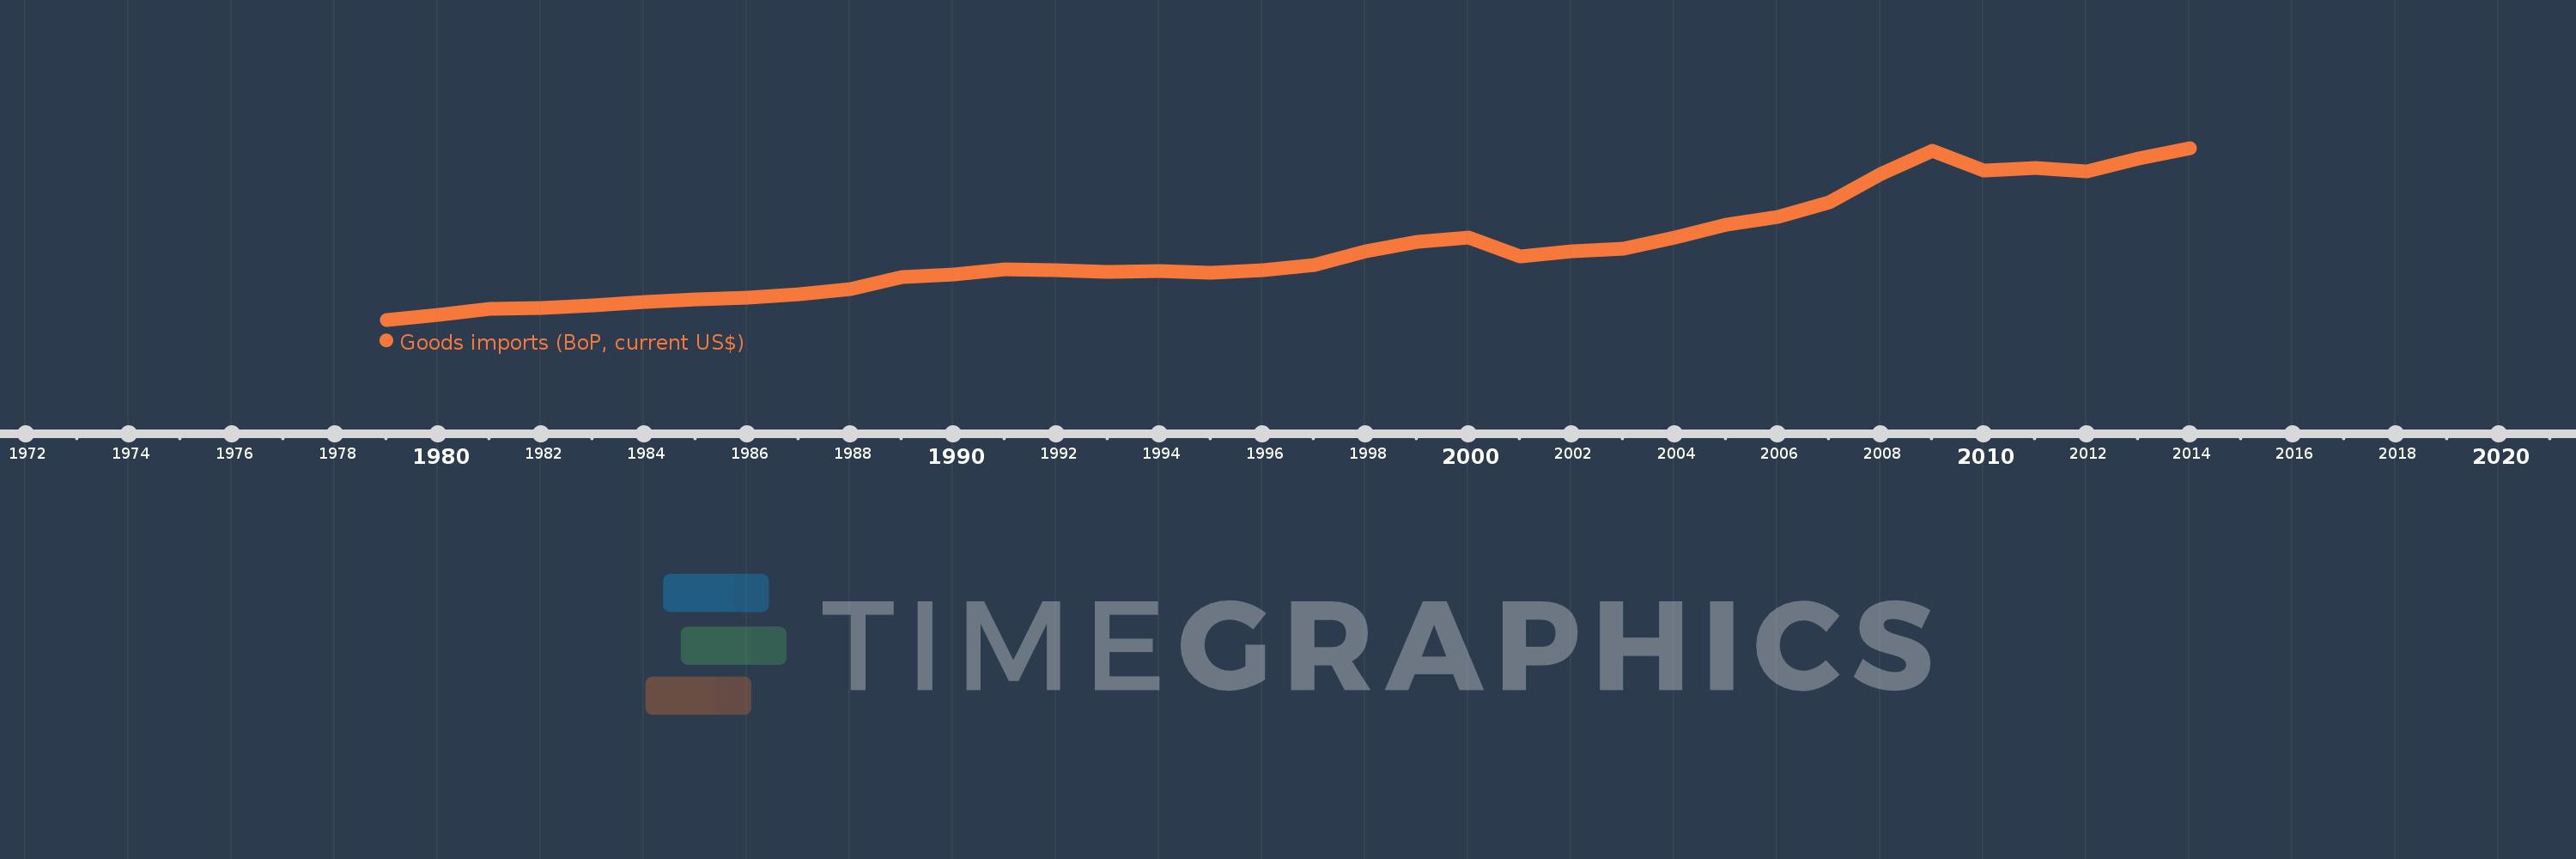
Goods imports (BoP, current US$)
2014,2013,2012,2011,2010,2009,2008,2007,2006,2005,2004,2003,2002,2001,2000,1999,1998,1997,1996,1995,1994,1993,1992,1991,1990,1989,1988,1987,1986,1985,1984,1983,1982,1981,1980,1979
This statistics in other country:
AfghanistanAlbaniaAlgeriaAngolaAntigua and BarbudaArab WorldArgentinaArmeniaArubaAustraliaAustriaAzerbaijanBahamas, TheBahrainBangladeshBarbadosBelarusBelgiumBelizeBeninBermudaBhutanBoliviaBosnia and HerzegovinaBotswanaBrazilBrunei DarussalamBulgariaBurkina FasoBurundiCabo VerdeCambodiaCameroonCanadaCaribbean small statesCentral African RepublicCentral Europe and the BalticsChadChileChinaColombiaComorosCongo, Dem. Rep.Congo, Rep.Costa RicaCote d'IvoireCroatiaCuracaoCyprusCzech RepublicDenmarkDjiboutiDominicaDominican RepublicEarly-demographic dividendEast Asia & PacificEast Asia & Pacific (excluding high income)East Asia & Pacific (IDA & IBRD countries)EcuadorEgypt, Arab Rep.El SalvadorEquatorial GuineaEritreaEstoniaEthiopiaEuro areaEurope & Central AsiaEurope & Central Asia (excluding high income)Europe & Central Asia (IDA & IBRD countries)European UnionFaroe IslandsFijiFinlandFragile and conflict affected situationsFranceFrench PolynesiaGabonGambia, TheGeorgiaGermanyGhanaGreeceGrenadaGuatemalaGuineaGuinea-BissauGuyanaHaitiHeavily indebted poor countries (HIPC)High incomeHondurasHong Kong SAR, ChinaHungaryIBRD onlyIcelandIDA & IBRD totalIDA blendIDA onlyIDA totalIndiaIndonesiaIran, Islamic Rep.IraqIrelandIsraelItalyJamaicaJapanJordanKazakhstanKenyaKiribatiKorea, Rep.KosovoKuwaitKyrgyz RepublicLao PDRLate-demographic dividendLatin America & Caribbean Latin America & Caribbean (excluding high income)Latin America & the Caribbean (IDA & IBRD countries)LatviaLeast developed countries: UN classificationLebanonLesothoLiberiaLibyaLithuaniaLow & middle incomeLow incomeLower middle incomeLuxembourgMacao SAR, ChinaMacedonia, FYRMadagascarMalawiMalaysiaMaldivesMaliMaltaMarshall IslandsMauritaniaMauritiusMexicoMicronesia, Fed. Sts.Middle East & North Africa (excluding high income)Middle East & North Africa (IDA & IBRD countries)Middle incomeMoldovaMongoliaMontenegroMoroccoMozambiqueMyanmarNamibiaNepalNetherlandsNew CaledoniaNew ZealandNicaraguaNigerNigeriaNorth AmericaNorwayOECD membersOmanOther small statesPacific island small statesPakistanPalauPanamaPapua New GuineaParaguayPeruPhilippinesPolandPortugalPost-demographic dividendPre-demographic dividendQatarRomaniaRussian FederationRwandaSamoaSao Tome and PrincipeSaudi ArabiaSenegalSerbiaSeychellesSierra LeoneSingaporeSint Maarten (Dutch part)Slovak RepublicSloveniaSmall statesSolomon IslandsSouth AfricaSouth AsiaSouth Asia (IDA & IBRD)South SudanSpainSri LankaSt. Kitts and NevisSt. LuciaSt. Vincent and the GrenadinesSub-Saharan Africa Sub-Saharan Africa (excluding high income)Sub-Saharan Africa (IDA & IBRD countries)SudanSurinameSwazilandSwedenSwitzerlandSyrian Arab RepublicTajikistanTanzaniaThailandTimor-LesteTogoTongaTrinidad and TobagoTunisiaTurkeyTuvaluUgandaUkraineUnited KingdomUnited StatesUpper middle incomeUruguayVanuatuVenezuela, RBVietnamWest Bank and GazaWorldYemen, Rep.ZambiaZimbabwe Timeline:
This timeline shows a graph from 1979 to 2014 of St. Vincent and the Grenadines. No data until 1978. Number of actual observations by date: 36.
Source name:
World Development Indicators
Source organization:
International Monetary Fund, Balance of Payments Statistics Yearbook and data files.
Categories, topics:
Economy & Growth, Trade
Last updated:
apr 23, 2017
Indicators value changes by year
Minimum:
32.911 mln
jan 1, 1979
Maximum:
333.465 mln
jan 1, 2014
At the date of observation
Value
Absolute change
Change from previous value
jan 1, 1979
32.911 mln
+32.911 mln
0.0%
jan 1, 1980
42.093 mln
+9.181 mln
27.9%
jan 1, 1981
51.911 mln
+9.819 mln
23.33%
jan 1, 1982
52.911 mln
+1000.0K
1.93%
jan 1, 1983
58.589 mln
+5.678 mln
10.73%
jan 1, 1984
63.359 mln
+4.77 mln
8.14%
jan 1, 1985
68.941 mln
+5.581 mln
8.81%
jan 1, 1986
71.281 mln
+2.341 mln
3.4%
jan 1, 1987
77.185 mln
+5.904 mln
8.28%
jan 1, 1988
86.333 mln
+9.148 mln
11.85%
jan 1, 1989
107.593 mln
+21.259 mln
24.62%
jan 1, 1990
112.556 mln
+4.963 mln
4.61%
jan 1, 1991
120.407 mln
+7.852 mln
6.98%
jan 1, 1992
120.352 mln
-55.556K
-0.05%
jan 1, 1993
116.87 mln
-3.481 mln
-2.89%
jan 1, 1994
118.115 mln
+1.244 mln
1.06%
jan 1, 1995
115.433 mln
-2.681 mln
-2.27%
jan 1, 1996
119.367 mln
+3.933 mln
3.41%
jan 1, 1997
128.07 mln
+8.704 mln
7.29%
jan 1, 1998
152.615 mln
+24.544 mln
19.16%
jan 1, 1999
169.959 mln
+17.344 mln
11.36%
jan 1, 2000
177.052 mln
+7.093 mln
4.17%
jan 1, 2001
144.356 mln
-32.696 mln
-18.47%
jan 1, 2002
151.97 mln
+7.614 mln
5.27%
jan 1, 2003
157.767 mln
+5.798 mln
3.82%
jan 1, 2004
176.804 mln
+19.037 mln
12.07%
jan 1, 2005
198.974 mln
+22.17 mln
12.54%
jan 1, 2006
212.391 mln
+13.417 mln
6.74%
jan 1, 2007
237.682 mln
+25.291 mln
11.91%
jan 1, 2008
287.911 mln
+50.229 mln
21.13%
jan 1, 2009
328.679 mln
+40.768 mln
14.16%
jan 1, 2010
293.808 mln
-34.871 mln
-10.61%
jan 1, 2011
297.717 mln
+3.909 mln
1.33%
jan 1, 2012
292.284 mln
-5.433 mln
-1.82%
jan 1, 2013
315.02 mln
+22.736 mln
7.78%
jan 1, 2014
333.465 mln
+18.445 mln
5.86%
Ranking of countries by current statistics by years


Comments: