29
/
en
AIzaSyAYiBZKx7MnpbEhh9jyipgxe19OcubqV5w
April 1, 2024
112283
Costa Rica
CRI
true
2
1
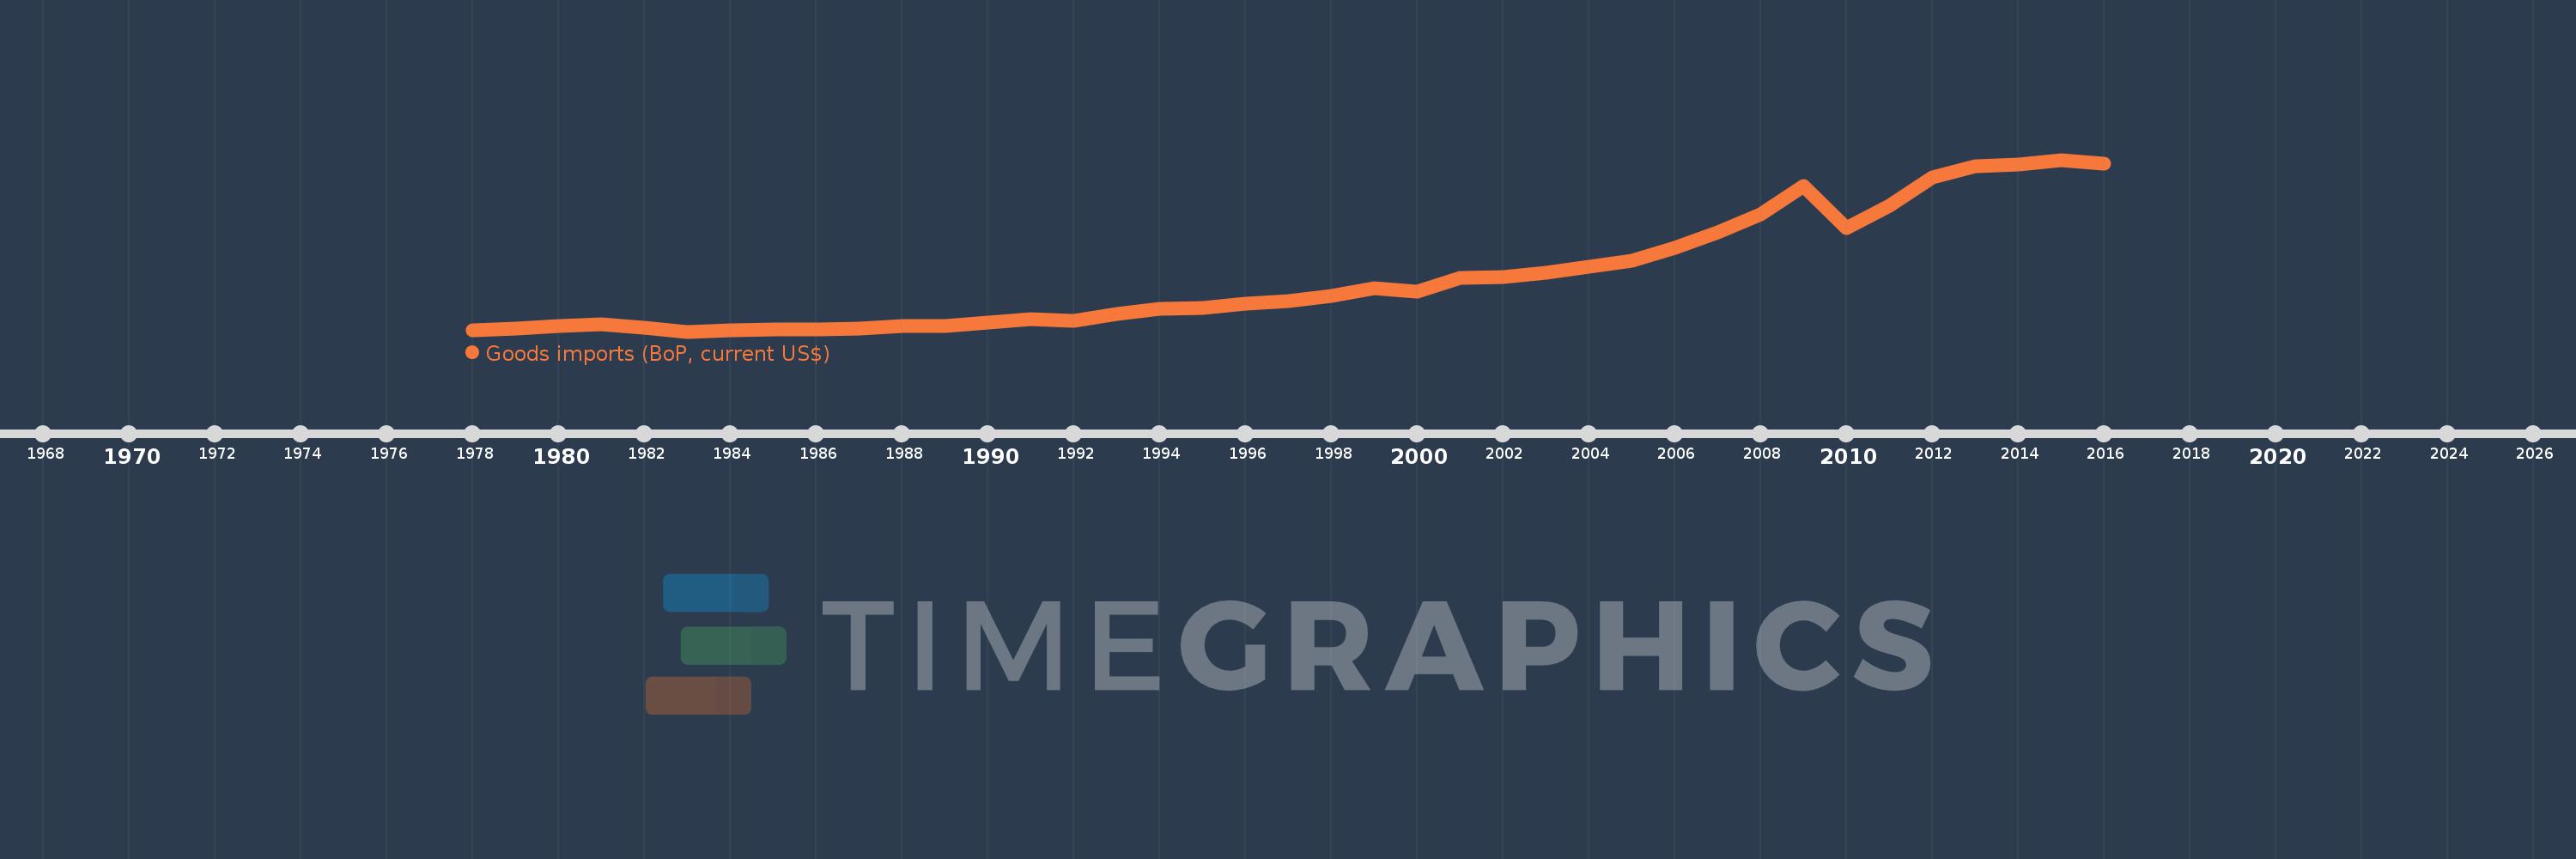
Goods imports (BoP, current US$)
2016,2015,2014,2013,2012,2011,2010,2009,2008,2007,2006,2005,2004,2003,2002,2001,2000,1999,1998,1997,1996,1995,1994,1993,1992,1991,1990,1989,1988,1987,1986,1985,1984,1983,1982,1981,1980,1979,1978
This statistics in other country:
AfghanistanAlbaniaAlgeriaAngolaAntigua and BarbudaArab WorldArgentinaArmeniaArubaAustraliaAustriaAzerbaijanBahamas, TheBahrainBangladeshBarbadosBelarusBelgiumBelizeBeninBermudaBhutanBoliviaBosnia and HerzegovinaBotswanaBrazilBrunei DarussalamBulgariaBurkina FasoBurundiCabo VerdeCambodiaCameroonCanadaCaribbean small statesCentral African RepublicCentral Europe and the BalticsChadChileChinaColombiaComorosCongo, Dem. Rep.Congo, Rep.Costa RicaCote d'IvoireCroatiaCuracaoCyprusCzech RepublicDenmarkDjiboutiDominicaDominican RepublicEarly-demographic dividendEast Asia & PacificEast Asia & Pacific (excluding high income)East Asia & Pacific (IDA & IBRD countries)EcuadorEgypt, Arab Rep.El SalvadorEquatorial GuineaEritreaEstoniaEthiopiaEuro areaEurope & Central AsiaEurope & Central Asia (excluding high income)Europe & Central Asia (IDA & IBRD countries)European UnionFaroe IslandsFijiFinlandFragile and conflict affected situationsFranceFrench PolynesiaGabonGambia, TheGeorgiaGermanyGhanaGreeceGrenadaGuatemalaGuineaGuinea-BissauGuyanaHaitiHeavily indebted poor countries (HIPC)High incomeHondurasHong Kong SAR, ChinaHungaryIBRD onlyIcelandIDA & IBRD totalIDA blendIDA onlyIDA totalIndiaIndonesiaIran, Islamic Rep.IraqIrelandIsraelItalyJamaicaJapanJordanKazakhstanKenyaKiribatiKorea, Rep.KosovoKuwaitKyrgyz RepublicLao PDRLate-demographic dividendLatin America & Caribbean Latin America & Caribbean (excluding high income)Latin America & the Caribbean (IDA & IBRD countries)LatviaLeast developed countries: UN classificationLebanonLesothoLiberiaLibyaLithuaniaLow & middle incomeLow incomeLower middle incomeLuxembourgMacao SAR, ChinaMacedonia, FYRMadagascarMalawiMalaysiaMaldivesMaliMaltaMarshall IslandsMauritaniaMauritiusMexicoMicronesia, Fed. Sts.Middle East & North Africa (excluding high income)Middle East & North Africa (IDA & IBRD countries)Middle incomeMoldovaMongoliaMontenegroMoroccoMozambiqueMyanmarNamibiaNepalNetherlandsNew CaledoniaNew ZealandNicaraguaNigerNigeriaNorth AmericaNorwayOECD membersOmanOther small statesPacific island small statesPakistanPalauPanamaPapua New GuineaParaguayPeruPhilippinesPolandPortugalPost-demographic dividendPre-demographic dividendQatarRomaniaRussian FederationRwandaSamoaSao Tome and PrincipeSaudi ArabiaSenegalSerbiaSeychellesSierra LeoneSingaporeSint Maarten (Dutch part)Slovak RepublicSloveniaSmall statesSolomon IslandsSouth AfricaSouth AsiaSouth Asia (IDA & IBRD)South SudanSpainSri LankaSt. Kitts and NevisSt. LuciaSt. Vincent and the GrenadinesSub-Saharan Africa Sub-Saharan Africa (excluding high income)Sub-Saharan Africa (IDA & IBRD countries)SudanSurinameSwazilandSwedenSwitzerlandSyrian Arab RepublicTajikistanTanzaniaThailandTimor-LesteTogoTongaTrinidad and TobagoTunisiaTurkeyTuvaluUgandaUkraineUnited KingdomUnited StatesUpper middle incomeUruguayVanuatuVenezuela, RBVietnamWest Bank and GazaWorldYemen, Rep.ZambiaZimbabwe Timeline:
This timeline shows a graph from 1978 to 2016 of Costa Rica. No data until 1977. Number of actual observations by date: 39.
Source name:
World Development Indicators
Source organization:
International Monetary Fund, Balance of Payments Statistics Yearbook and data files.
Categories, topics:
Economy & Growth, Trade
Last updated:
apr 23, 2017
Indicators value changes by year
Minimum:
804.9 mln
jan 1, 1983
Maximum:
14.784 bln
jan 1, 2015
At the date of observation
Value
Absolute change
Change from previous value
jan 1, 1978
925.1 mln
+925.1 mln
0.0%
jan 1, 1979
1.049 bln
+124.3 mln
13.44%
jan 1, 1980
1.257 bln
+207.8 mln
19.8%
jan 1, 1981
1.375 bln
+118.0 mln
9.39%
jan 1, 1982
1.091 bln
-284.6 mln
-20.7%
jan 1, 1983
804.9 mln
-285.7 mln
-26.2%
jan 1, 1984
894.3 mln
+89.4 mln
11.11%
jan 1, 1985
992.9 mln
+98.6 mln
11.03%
jan 1, 1986
1.001 bln
+8.1 mln
0.82%
jan 1, 1987
1.045 bln
+44.2 mln
4.42%
jan 1, 1988
1.245 bln
+200.0 mln
19.14%
jan 1, 1989
1.279 bln
+33.4 mln
2.68%
jan 1, 1990
1.572 bln
+293.4 mln
22.95%
jan 1, 1991
1.797 bln
+224.7 mln
14.29%
jan 1, 1992
1.698 bln
-99.1 mln
-5.52%
jan 1, 1993
2.211 bln
+513.3 mln
30.24%
jan 1, 1994
2.628 bln
+416.7 mln
18.85%
jan 1, 1995
2.728 bln
+100.2 mln
3.81%
jan 1, 1996
3.046 bln
+318.3 mln
11.67%
jan 1, 1997
3.259 bln
+213.28 mln
7.0%
jan 1, 1998
3.675 bln
+415.38 mln
12.74%
jan 1, 1999
4.3 bln
+625.55 mln
17.02%
jan 1, 2000
4.022 bln
-278.558 mln
-6.48%
jan 1, 2001
5.181 bln
+1.159 bln
28.82%
jan 1, 2002
5.241 bln
+59.772 mln
1.15%
jan 1, 2003
5.619 bln
+378.239 mln
7.22%
jan 1, 2004
6.056 bln
+436.903 mln
7.78%
jan 1, 2005
6.543 bln
+486.655 mln
8.04%
jan 1, 2006
7.615 bln
+1.073 bln
16.39%
jan 1, 2007
8.843 bln
+1.228 bln
16.13%
jan 1, 2008
10.329 bln
+1.486 bln
16.81%
jan 1, 2009
12.659 bln
+2.329 bln
22.55%
jan 1, 2010
9.205 bln
-3.454 bln
-27.29%
jan 1, 2011
11.04 bln
+1.836 bln
19.94%
jan 1, 2012
13.329 bln
+2.288 bln
20.73%
jan 1, 2013
14.271 bln
+941.9 mln
7.07%
jan 1, 2014
14.425 bln
+154.535 mln
1.08%
jan 1, 2015
14.784 bln
+359.186 mln
2.49%
jan 1, 2016
14.464 bln
-320.815 mln
-2.17%
Ranking of countries by current statistics by years


Comments: