29
/
en
AIzaSyAYiBZKx7MnpbEhh9jyipgxe19OcubqV5w
April 1, 2024
140420
Ghana
GHA
true
2
1
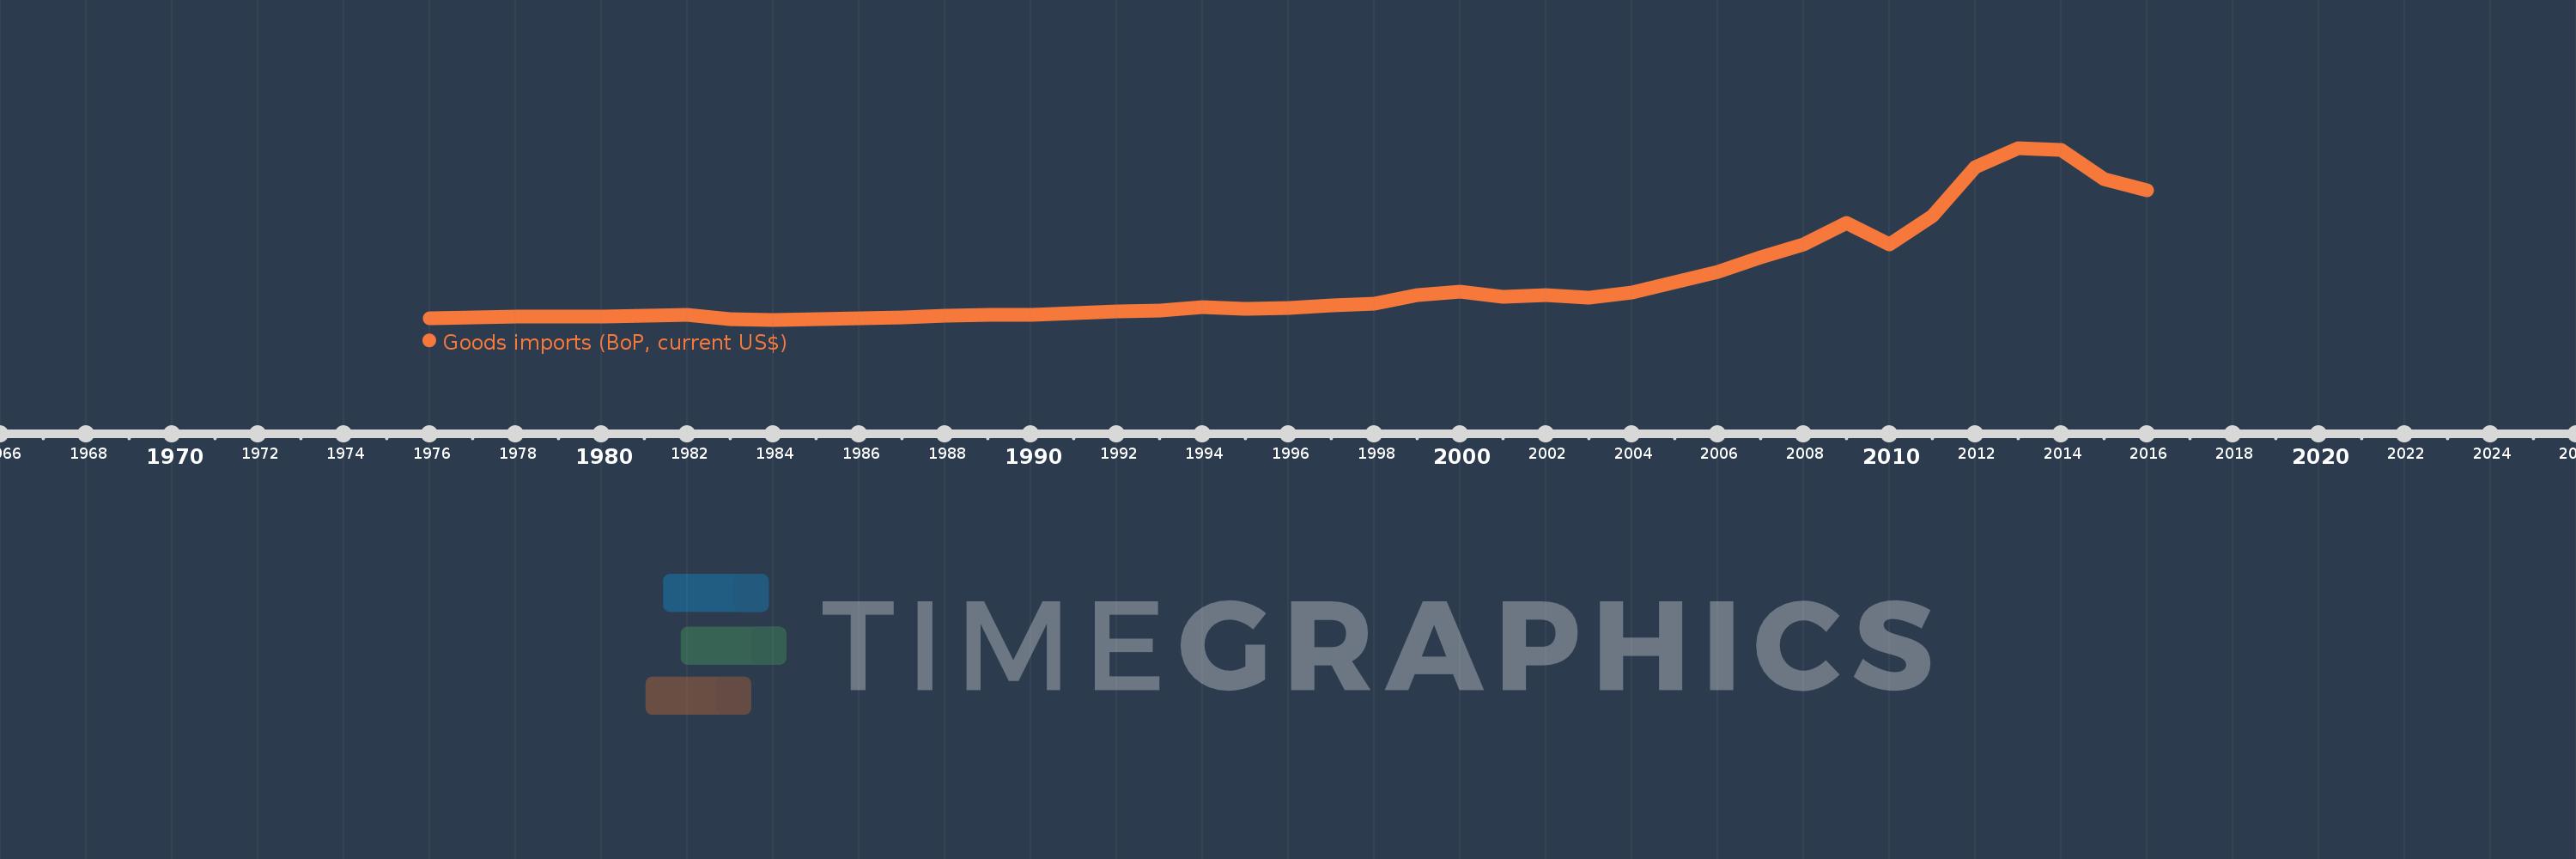
Goods imports (BoP, current US$)
2016,2015,2014,2013,2012,2011,2010,2009,2008,2007,2006,2005,2004,2003,2002,2001,2000,1999,1998,1997,1996,1995,1994,1993,1992,1991,1990,1989,1988,1987,1986,1985,1984,1983,1982,1981,1980,1979,1978,1977,1976
This statistics in other country:
AfghanistanAlbaniaAlgeriaAngolaAntigua and BarbudaArab WorldArgentinaArmeniaArubaAustraliaAustriaAzerbaijanBahamas, TheBahrainBangladeshBarbadosBelarusBelgiumBelizeBeninBermudaBhutanBoliviaBosnia and HerzegovinaBotswanaBrazilBrunei DarussalamBulgariaBurkina FasoBurundiCabo VerdeCambodiaCameroonCanadaCaribbean small statesCentral African RepublicCentral Europe and the BalticsChadChileChinaColombiaComorosCongo, Dem. Rep.Congo, Rep.Costa RicaCote d'IvoireCroatiaCuracaoCyprusCzech RepublicDenmarkDjiboutiDominicaDominican RepublicEarly-demographic dividendEast Asia & PacificEast Asia & Pacific (excluding high income)East Asia & Pacific (IDA & IBRD countries)EcuadorEgypt, Arab Rep.El SalvadorEquatorial GuineaEritreaEstoniaEthiopiaEuro areaEurope & Central AsiaEurope & Central Asia (excluding high income)Europe & Central Asia (IDA & IBRD countries)European UnionFaroe IslandsFijiFinlandFragile and conflict affected situationsFranceFrench PolynesiaGabonGambia, TheGeorgiaGermanyGhanaGreeceGrenadaGuatemalaGuineaGuinea-BissauGuyanaHaitiHeavily indebted poor countries (HIPC)High incomeHondurasHong Kong SAR, ChinaHungaryIBRD onlyIcelandIDA & IBRD totalIDA blendIDA onlyIDA totalIndiaIndonesiaIran, Islamic Rep.IraqIrelandIsraelItalyJamaicaJapanJordanKazakhstanKenyaKiribatiKorea, Rep.KosovoKuwaitKyrgyz RepublicLao PDRLate-demographic dividendLatin America & Caribbean Latin America & Caribbean (excluding high income)Latin America & the Caribbean (IDA & IBRD countries)LatviaLeast developed countries: UN classificationLebanonLesothoLiberiaLibyaLithuaniaLow & middle incomeLow incomeLower middle incomeLuxembourgMacao SAR, ChinaMacedonia, FYRMadagascarMalawiMalaysiaMaldivesMaliMaltaMarshall IslandsMauritaniaMauritiusMexicoMicronesia, Fed. Sts.Middle East & North Africa (excluding high income)Middle East & North Africa (IDA & IBRD countries)Middle incomeMoldovaMongoliaMontenegroMoroccoMozambiqueMyanmarNamibiaNepalNetherlandsNew CaledoniaNew ZealandNicaraguaNigerNigeriaNorth AmericaNorwayOECD membersOmanOther small statesPacific island small statesPakistanPalauPanamaPapua New GuineaParaguayPeruPhilippinesPolandPortugalPost-demographic dividendPre-demographic dividendQatarRomaniaRussian FederationRwandaSamoaSao Tome and PrincipeSaudi ArabiaSenegalSerbiaSeychellesSierra LeoneSingaporeSint Maarten (Dutch part)Slovak RepublicSloveniaSmall statesSolomon IslandsSouth AfricaSouth AsiaSouth Asia (IDA & IBRD)South SudanSpainSri LankaSt. Kitts and NevisSt. LuciaSt. Vincent and the GrenadinesSub-Saharan Africa Sub-Saharan Africa (excluding high income)Sub-Saharan Africa (IDA & IBRD countries)SudanSurinameSwazilandSwedenSwitzerlandSyrian Arab RepublicTajikistanTanzaniaThailandTimor-LesteTogoTongaTrinidad and TobagoTunisiaTurkeyTuvaluUgandaUkraineUnited KingdomUnited StatesUpper middle incomeUruguayVanuatuVenezuela, RBVietnamWest Bank and GazaWorldYemen, Rep.ZambiaZimbabwe Timeline:
This timeline shows a graph from 1976 to 2016 of Ghana. No data until 1975. Number of actual observations by date: 41.
Source name:
World Development Indicators
Source organization:
International Monetary Fund, Balance of Payments Statistics Yearbook and data files.
Categories, topics:
Economy & Growth, Trade
Last updated:
apr 23, 2017
Indicators value changes by year
Minimum:
499.7 mln
jan 1, 1984
Maximum:
17.763 bln
jan 1, 2013
At the date of observation
Value
Absolute change
Change from previous value
jan 1, 1976
650.525 mln
+650.525 mln
0.0%
jan 1, 1977
690.265 mln
+39.739 mln
6.11%
jan 1, 1978
860.178 mln
+169.913 mln
24.62%
jan 1, 1979
780.292 mln
-79.886 mln
-9.29%
jan 1, 1980
803.1 mln
+22.808 mln
2.92%
jan 1, 1981
908.3 mln
+105.2 mln
13.1%
jan 1, 1982
954.3 mln
+46.0 mln
5.06%
jan 1, 1983
588.7 mln
-365.6 mln
-38.31%
jan 1, 1984
499.7 mln
-89.0 mln
-15.12%
jan 1, 1985
533.0 mln
+33.3 mln
6.66%
jan 1, 1986
668.7 mln
+135.7 mln
25.46%
jan 1, 1987
735.1 mln
+66.4 mln
9.93%
jan 1, 1988
933.9 mln
+198.8 mln
27.04%
jan 1, 1989
993.4 mln
+59.5 mln
6.37%
jan 1, 1990
1.012 bln
+18.2 mln
1.83%
jan 1, 1991
1.205 bln
+193.4 mln
19.12%
jan 1, 1992
1.319 bln
+113.7 mln
9.44%
jan 1, 1993
1.456 bln
+137.8 mln
10.45%
jan 1, 1994
1.728 bln
+271.5 mln
18.64%
jan 1, 1995
1.58 bln
-148.1 mln
-8.57%
jan 1, 1996
1.688 bln
+107.9 mln
6.83%
jan 1, 1997
1.951 bln
+262.85 mln
15.57%
jan 1, 1998
2.144 bln
+193.07 mln
9.9%
jan 1, 1999
2.992 bln
+847.88 mln
39.55%
jan 1, 2000
3.28 bln
+288.3 mln
9.64%
jan 1, 2001
2.767 bln
-513.345 mln
-15.65%
jan 1, 2002
2.969 bln
+201.957 mln
7.3%
jan 1, 2003
2.707 bln
-261.493 mln
-8.81%
jan 1, 2004
3.233 bln
+525.805 mln
19.42%
jan 1, 2005
4.297 bln
+1.064 bln
32.93%
jan 1, 2006
5.347 bln
+1.05 bln
24.43%
jan 1, 2007
6.754 bln
+1.406 bln
26.3%
jan 1, 2008
8.066 bln
+1.312 bln
19.43%
jan 1, 2009
10.268 bln
+2.202 bln
27.3%
jan 1, 2010
8.046 bln
-2.222 bln
-21.64%
jan 1, 2011
10.922 bln
+2.876 bln
35.74%
jan 1, 2012
15.838 bln
+4.916 bln
45.01%
jan 1, 2013
17.763 bln
+1.925 bln
12.16%
jan 1, 2014
17.6 bln
-162.928 mln
-0.92%
jan 1, 2015
14.6 bln
-3.0 bln
-17.05%
jan 1, 2016
13.465 bln
-1.135 bln
-7.77%
Ranking of countries by current statistics by years


Comments: