29
/
en
AIzaSyAYiBZKx7MnpbEhh9jyipgxe19OcubqV5w
April 1, 2024
58116
South Asia (IDA & IBRD)
TSA
false
2
1
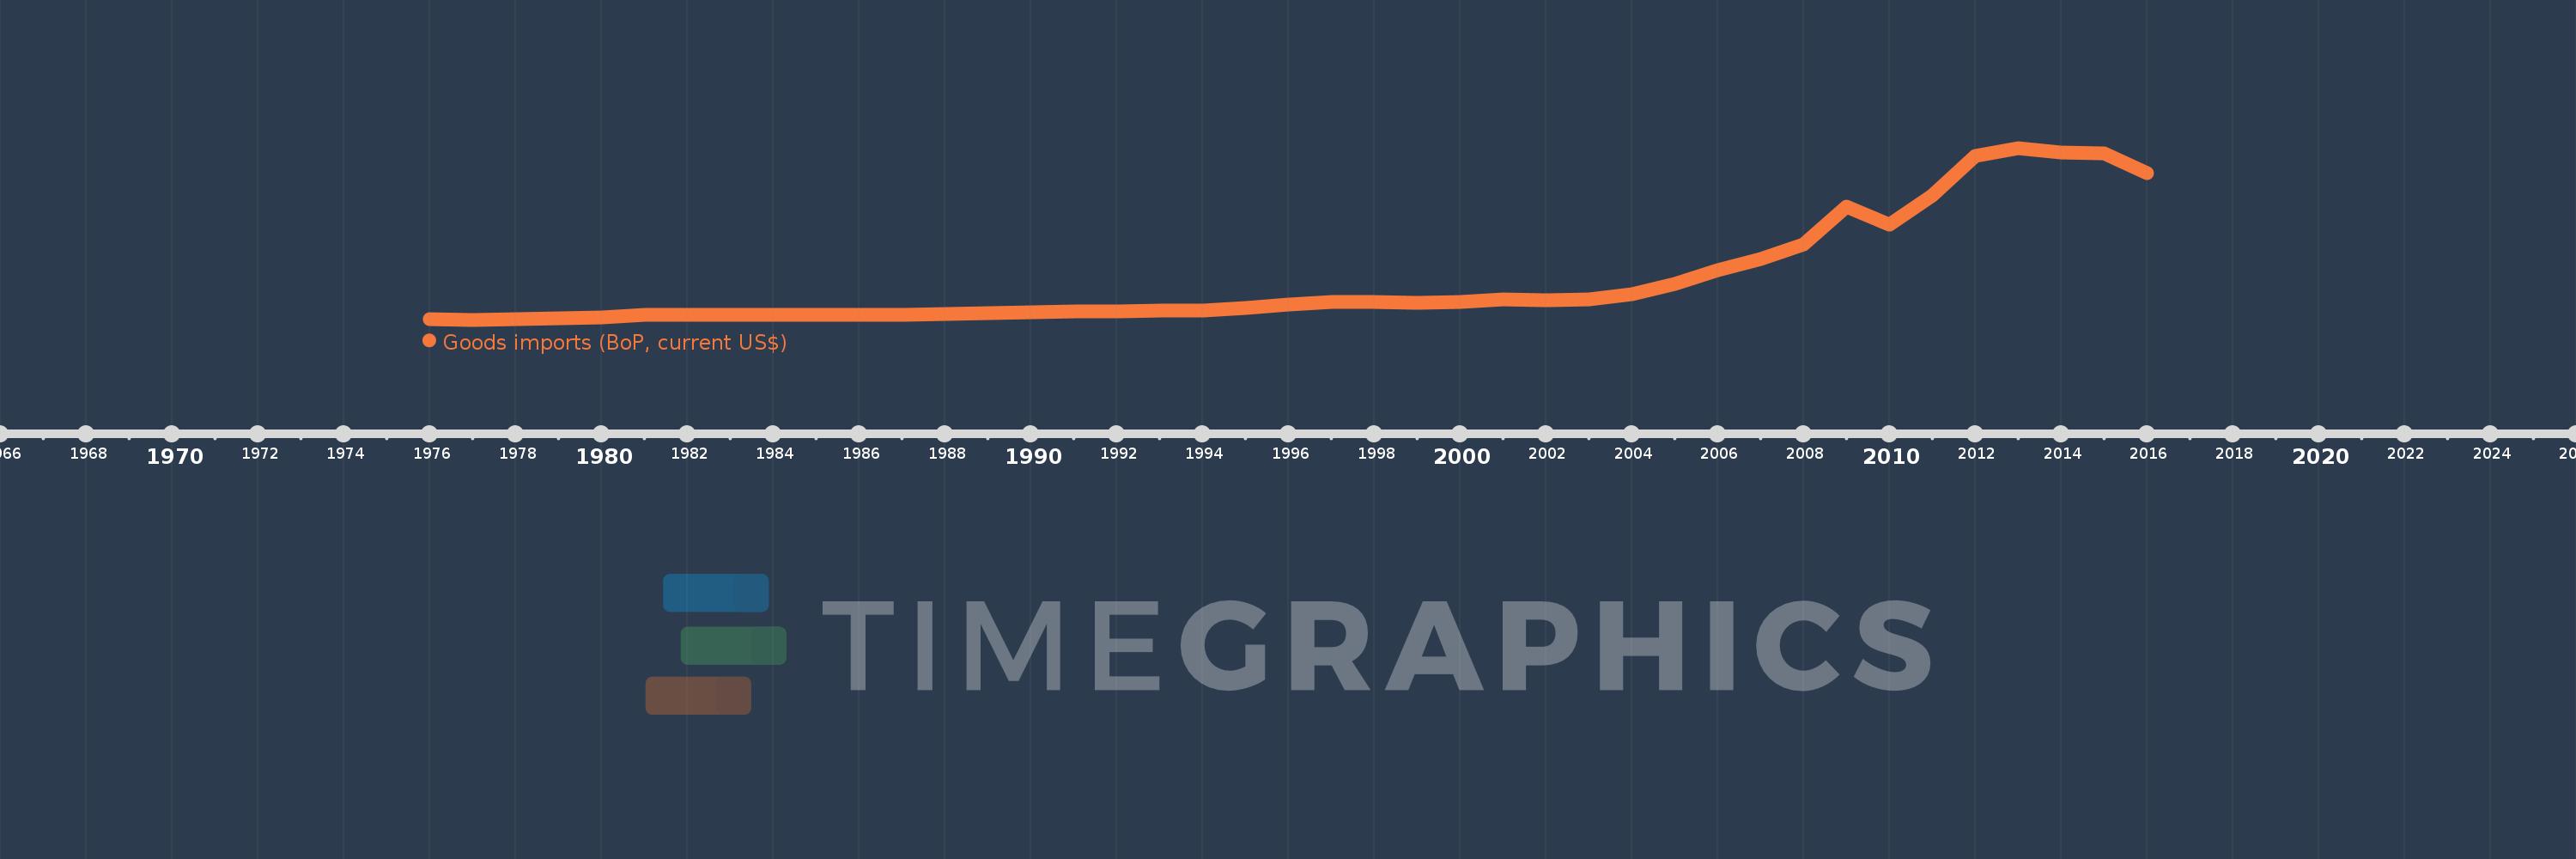
Goods imports (BoP, current US$)
2016,2015,2014,2013,2012,2011,2010,2009,2008,2007,2006,2005,2004,2003,2002,2001,2000,1999,1998,1997,1996,1995,1994,1993,1992,1991,1990,1989,1988,1987,1986,1985,1984,1983,1982,1981,1980,1979,1978,1977,1976
This statistics in other country:
AfghanistanAlbaniaAlgeriaAngolaAntigua and BarbudaArab WorldArgentinaArmeniaArubaAustraliaAustriaAzerbaijanBahamas, TheBahrainBangladeshBarbadosBelarusBelgiumBelizeBeninBermudaBhutanBoliviaBosnia and HerzegovinaBotswanaBrazilBrunei DarussalamBulgariaBurkina FasoBurundiCabo VerdeCambodiaCameroonCanadaCaribbean small statesCentral African RepublicCentral Europe and the BalticsChadChileChinaColombiaComorosCongo, Dem. Rep.Congo, Rep.Costa RicaCote d'IvoireCroatiaCuracaoCyprusCzech RepublicDenmarkDjiboutiDominicaDominican RepublicEarly-demographic dividendEast Asia & PacificEast Asia & Pacific (excluding high income)East Asia & Pacific (IDA & IBRD countries)EcuadorEgypt, Arab Rep.El SalvadorEquatorial GuineaEritreaEstoniaEthiopiaEuro areaEurope & Central AsiaEurope & Central Asia (excluding high income)Europe & Central Asia (IDA & IBRD countries)European UnionFaroe IslandsFijiFinlandFragile and conflict affected situationsFranceFrench PolynesiaGabonGambia, TheGeorgiaGermanyGhanaGreeceGrenadaGuatemalaGuineaGuinea-BissauGuyanaHaitiHeavily indebted poor countries (HIPC)High incomeHondurasHong Kong SAR, ChinaHungaryIBRD onlyIcelandIDA & IBRD totalIDA blendIDA onlyIDA totalIndiaIndonesiaIran, Islamic Rep.IraqIrelandIsraelItalyJamaicaJapanJordanKazakhstanKenyaKiribatiKorea, Rep.KosovoKuwaitKyrgyz RepublicLao PDRLate-demographic dividendLatin America & Caribbean Latin America & Caribbean (excluding high income)Latin America & the Caribbean (IDA & IBRD countries)LatviaLeast developed countries: UN classificationLebanonLesothoLiberiaLibyaLithuaniaLow & middle incomeLow incomeLower middle incomeLuxembourgMacao SAR, ChinaMacedonia, FYRMadagascarMalawiMalaysiaMaldivesMaliMaltaMarshall IslandsMauritaniaMauritiusMexicoMicronesia, Fed. Sts.Middle East & North Africa (excluding high income)Middle East & North Africa (IDA & IBRD countries)Middle incomeMoldovaMongoliaMontenegroMoroccoMozambiqueMyanmarNamibiaNepalNetherlandsNew CaledoniaNew ZealandNicaraguaNigerNigeriaNorth AmericaNorwayOECD membersOmanOther small statesPacific island small statesPakistanPalauPanamaPapua New GuineaParaguayPeruPhilippinesPolandPortugalPost-demographic dividendPre-demographic dividendQatarRomaniaRussian FederationRwandaSamoaSao Tome and PrincipeSaudi ArabiaSenegalSerbiaSeychellesSierra LeoneSingaporeSint Maarten (Dutch part)Slovak RepublicSloveniaSmall statesSolomon IslandsSouth AfricaSouth AsiaSouth Asia (IDA & IBRD)South SudanSpainSri LankaSt. Kitts and NevisSt. LuciaSt. Vincent and the GrenadinesSub-Saharan Africa Sub-Saharan Africa (excluding high income)Sub-Saharan Africa (IDA & IBRD countries)SudanSurinameSwazilandSwedenSwitzerlandSyrian Arab RepublicTajikistanTanzaniaThailandTimor-LesteTogoTongaTrinidad and TobagoTunisiaTurkeyTuvaluUgandaUkraineUnited KingdomUnited StatesUpper middle incomeUruguayVanuatuVenezuela, RBVietnamWest Bank and GazaWorldYemen, Rep.ZambiaZimbabwe Timeline:
This timeline shows a graph from 1976 to 2016 of South Asia (IDA & IBRD). No data until 1975. Number of actual observations by date: 41.
Source name:
World Development Indicators
Source organization:
International Monetary Fund, Balance of Payments Statistics Yearbook and data files.
Categories, topics:
Economy & Growth, Trade
Last updated:
apr 23, 2017
Indicators value changes by year
Minimum:
8.617 bln
jan 1, 1977
Maximum:
608.203 bln
jan 1, 2013
At the date of observation
Value
Absolute change
Change from previous value
jan 1, 1976
9.338 bln
+9.338 bln
0.0%
jan 1, 1977
8.617 bln
-721.367 mln
-7.73%
jan 1, 1978
9.934 bln
+1.317 bln
15.29%
jan 1, 1979
13.475 bln
+3.541 bln
35.65%
jan 1, 1980
17.914 bln
+4.439 bln
32.94%
jan 1, 1981
24.561 bln
+6.646 bln
37.1%
jan 1, 1982
25.057 bln
+496.751 mln
2.02%
jan 1, 1983
24.911 bln
-146.488 mln
-0.58%
jan 1, 1984
24.36 bln
-550.551 mln
-2.21%
jan 1, 1985
25.975 bln
+1.615 bln
6.63%
jan 1, 1986
26.321 bln
+345.8 mln
1.33%
jan 1, 1987
27.167 bln
+846.366 mln
3.22%
jan 1, 1988
29.499 bln
+2.331 bln
8.58%
jan 1, 1989
33.187 bln
+3.689 bln
12.5%
jan 1, 1990
36.02 bln
+2.832 bln
8.53%
jan 1, 1991
38.293 bln
+2.273 bln
6.31%
jan 1, 1992
36.889 bln
-1.404 bln
-3.67%
jan 1, 1993
40.306 bln
+3.417 bln
9.26%
jan 1, 1994
42.095 bln
+1.789 bln
4.44%
jan 1, 1995
49.479 bln
+7.384 bln
17.54%
jan 1, 1996
62.161 bln
+12.682 bln
25.63%
jan 1, 1997
69.507 bln
+7.346 bln
11.82%
jan 1, 1998
70.954 bln
+1.447 bln
2.08%
jan 1, 1999
68.87 bln
-2.084 bln
-2.94%
jan 1, 2000
70.454 bln
+1.583 bln
2.3%
jan 1, 2001
80.966 bln
+10.512 bln
14.92%
jan 1, 2002
76.984 bln
-3.982 bln
-4.92%
jan 1, 2003
80.845 bln
+3.861 bln
5.02%
jan 1, 2004
98.398 bln
+17.553 bln
21.71%
jan 1, 2005
134.104 bln
+35.706 bln
36.29%
jan 1, 2006
181.706 bln
+47.602 bln
35.5%
jan 1, 2007
221.931 bln
+40.225 bln
22.14%
jan 1, 2008
270.568 bln
+48.638 bln
21.92%
jan 1, 2009
404.869 bln
+134.301 bln
49.64%
jan 1, 2010
341.845 bln
-63.024 bln
-15.57%
jan 1, 2011
441.902 bln
+100.057 bln
29.27%
jan 1, 2012
579.394 bln
+137.492 bln
31.11%
jan 1, 2013
608.203 bln
+28.809 bln
4.97%
jan 1, 2014
592.507 bln
-15.697 bln
-2.58%
jan 1, 2015
589.096 bln
-3.411 bln
-0.58%
jan 1, 2016
521.513 bln
-67.583 bln
-11.47%
Ranking of countries by current statistics by years


Comments: