29
/
en
AIzaSyAYiBZKx7MnpbEhh9jyipgxe19OcubqV5w
April 1, 2024
36595
IBRD only
IBD
false
2
1
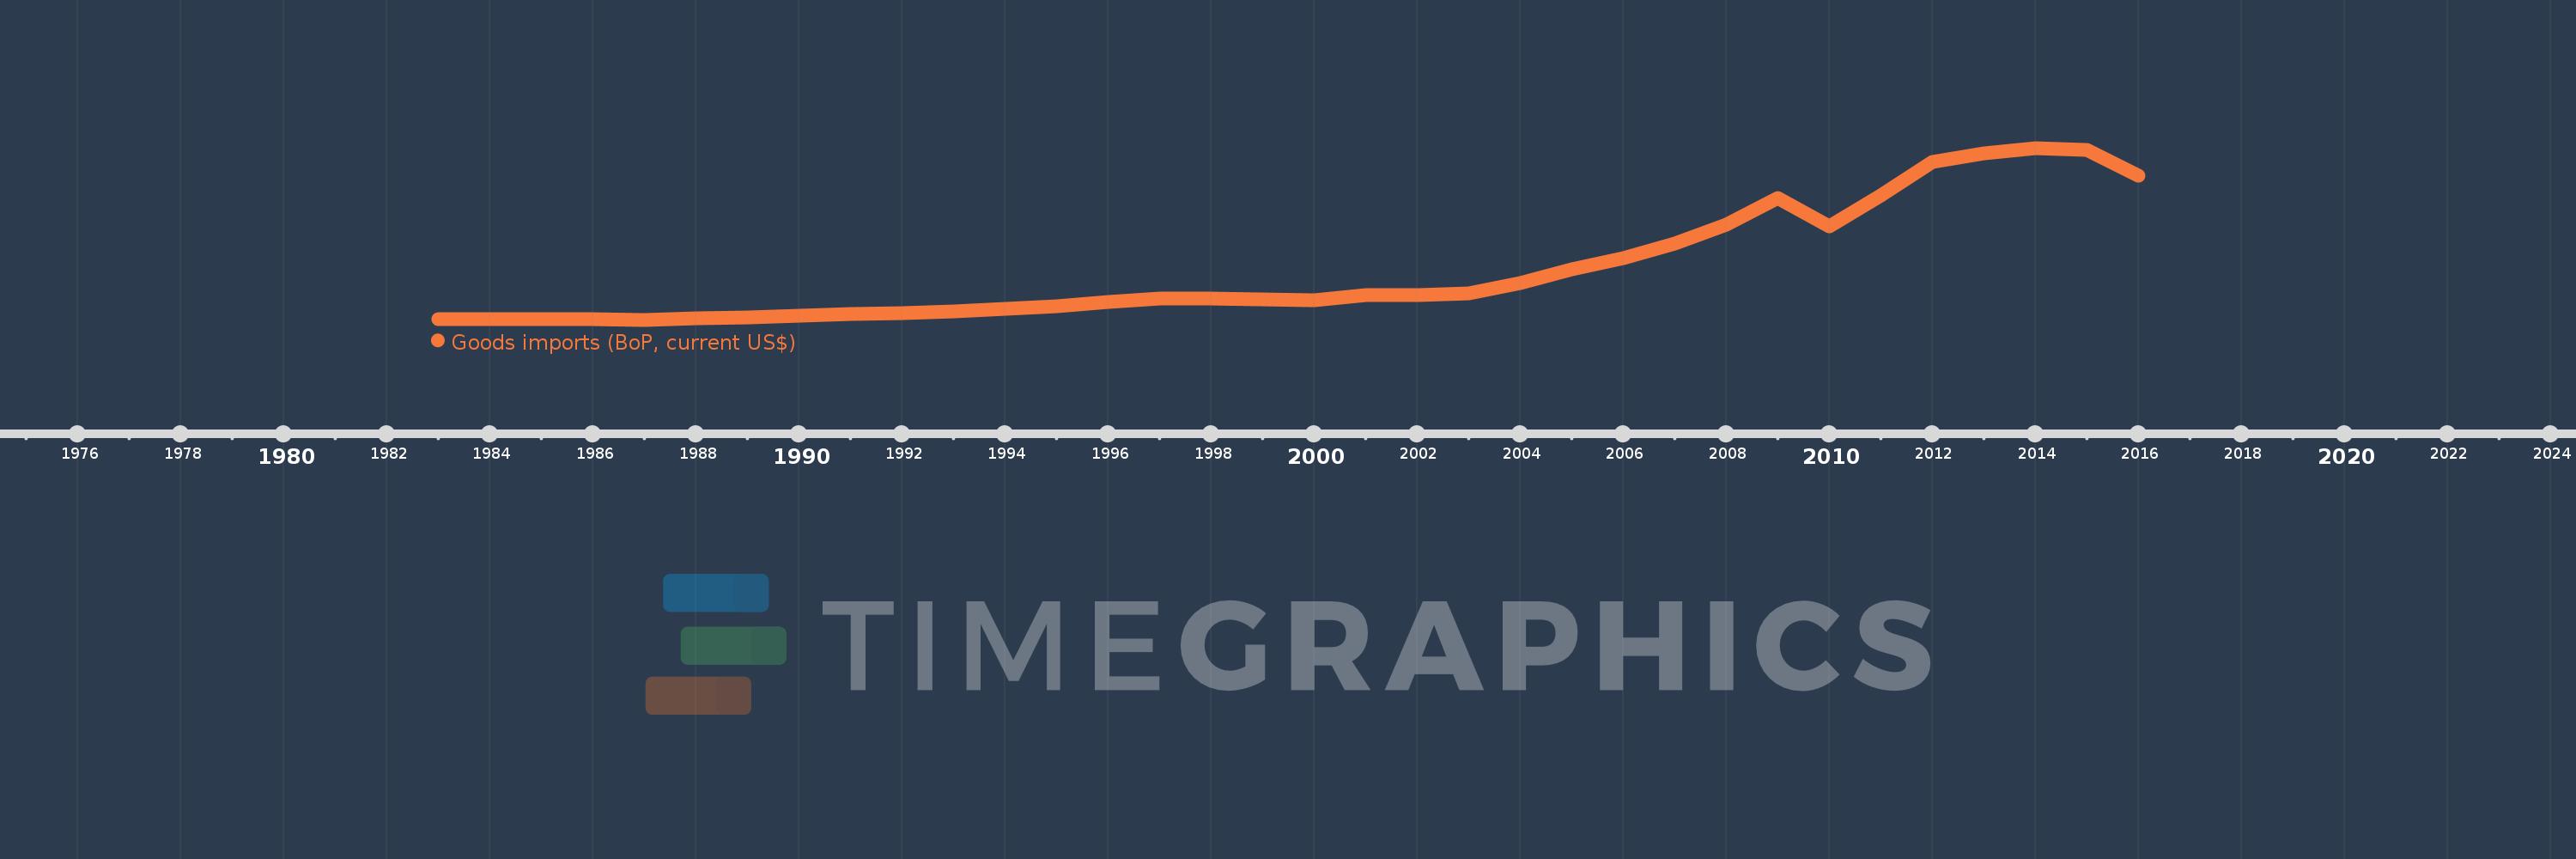
Goods imports (BoP, current US$)
2016,2015,2014,2013,2012,2011,2010,2009,2008,2007,2006,2005,2004,2003,2002,2001,2000,1999,1998,1997,1996,1995,1994,1993,1992,1991,1990,1989,1988,1987,1986,1985,1984,1983
This statistics in other country:
AfghanistanAlbaniaAlgeriaAngolaAntigua and BarbudaArab WorldArgentinaArmeniaArubaAustraliaAustriaAzerbaijanBahamas, TheBahrainBangladeshBarbadosBelarusBelgiumBelizeBeninBermudaBhutanBoliviaBosnia and HerzegovinaBotswanaBrazilBrunei DarussalamBulgariaBurkina FasoBurundiCabo VerdeCambodiaCameroonCanadaCaribbean small statesCentral African RepublicCentral Europe and the BalticsChadChileChinaColombiaComorosCongo, Dem. Rep.Congo, Rep.Costa RicaCote d'IvoireCroatiaCuracaoCyprusCzech RepublicDenmarkDjiboutiDominicaDominican RepublicEarly-demographic dividendEast Asia & PacificEast Asia & Pacific (excluding high income)East Asia & Pacific (IDA & IBRD countries)EcuadorEgypt, Arab Rep.El SalvadorEquatorial GuineaEritreaEstoniaEthiopiaEuro areaEurope & Central AsiaEurope & Central Asia (excluding high income)Europe & Central Asia (IDA & IBRD countries)European UnionFaroe IslandsFijiFinlandFragile and conflict affected situationsFranceFrench PolynesiaGabonGambia, TheGeorgiaGermanyGhanaGreeceGrenadaGuatemalaGuineaGuinea-BissauGuyanaHaitiHeavily indebted poor countries (HIPC)High incomeHondurasHong Kong SAR, ChinaHungaryIBRD onlyIcelandIDA & IBRD totalIDA blendIDA onlyIDA totalIndiaIndonesiaIran, Islamic Rep.IraqIrelandIsraelItalyJamaicaJapanJordanKazakhstanKenyaKiribatiKorea, Rep.KosovoKuwaitKyrgyz RepublicLao PDRLate-demographic dividendLatin America & Caribbean Latin America & Caribbean (excluding high income)Latin America & the Caribbean (IDA & IBRD countries)LatviaLeast developed countries: UN classificationLebanonLesothoLiberiaLibyaLithuaniaLow & middle incomeLow incomeLower middle incomeLuxembourgMacao SAR, ChinaMacedonia, FYRMadagascarMalawiMalaysiaMaldivesMaliMaltaMarshall IslandsMauritaniaMauritiusMexicoMicronesia, Fed. Sts.Middle East & North Africa (excluding high income)Middle East & North Africa (IDA & IBRD countries)Middle incomeMoldovaMongoliaMontenegroMoroccoMozambiqueMyanmarNamibiaNepalNetherlandsNew CaledoniaNew ZealandNicaraguaNigerNigeriaNorth AmericaNorwayOECD membersOmanOther small statesPacific island small statesPakistanPalauPanamaPapua New GuineaParaguayPeruPhilippinesPolandPortugalPost-demographic dividendPre-demographic dividendQatarRomaniaRussian FederationRwandaSamoaSao Tome and PrincipeSaudi ArabiaSenegalSerbiaSeychellesSierra LeoneSingaporeSint Maarten (Dutch part)Slovak RepublicSloveniaSmall statesSolomon IslandsSouth AfricaSouth AsiaSouth Asia (IDA & IBRD)South SudanSpainSri LankaSt. Kitts and NevisSt. LuciaSt. Vincent and the GrenadinesSub-Saharan Africa Sub-Saharan Africa (excluding high income)Sub-Saharan Africa (IDA & IBRD countries)SudanSurinameSwazilandSwedenSwitzerlandSyrian Arab RepublicTajikistanTanzaniaThailandTimor-LesteTogoTongaTrinidad and TobagoTunisiaTurkeyTuvaluUgandaUkraineUnited KingdomUnited StatesUpper middle incomeUruguayVanuatuVenezuela, RBVietnamWest Bank and GazaWorldYemen, Rep.ZambiaZimbabwe Timeline:
This timeline shows a graph from 1983 to 2016 of IBRD only. No data until 1982. Number of actual observations by date: 34.
Source name:
World Development Indicators
Source organization:
International Monetary Fund, Balance of Payments Statistics Yearbook and data files.
Categories, topics:
Economy & Growth, Trade
Last updated:
apr 23, 2017
Indicators value changes by year
Minimum:
281.528 bln
jan 1, 1987
Maximum:
5.67 trl
jan 1, 2014
At the date of observation
Value
Absolute change
Change from previous value
jan 1, 1983
312.771 bln
+312.771 bln
0.0%
jan 1, 1984
291.36 bln
-21.41 bln
-6.85%
jan 1, 1985
296.32 bln
+4.96 bln
1.7%
jan 1, 1986
292.769 bln
-3.551 bln
-1.2%
jan 1, 1987
281.528 bln
-11.241 bln
-3.84%
jan 1, 1988
315.264 bln
+33.737 bln
11.98%
jan 1, 1989
361.524 bln
+46.26 bln
14.67%
jan 1, 1990
400.161 bln
+38.637 bln
10.69%
jan 1, 1991
449.346 bln
+49.185 bln
12.29%
jan 1, 1992
490.843 bln
+41.497 bln
9.23%
jan 1, 1993
554.095 bln
+63.252 bln
12.89%
jan 1, 1994
625.168 bln
+71.073 bln
12.83%
jan 1, 1995
695.687 bln
+70.519 bln
11.28%
jan 1, 1996
842.297 bln
+146.61 bln
21.07%
jan 1, 1997
937.805 bln
+95.508 bln
11.34%
jan 1, 1998
936.546 bln
-1.259 bln
-0.13%
jan 1, 1999
910.593 bln
-25.953 bln
-2.77%
jan 1, 2000
886.78 bln
-23.812 bln
-2.62%
jan 1, 2001
1.068 trl
+180.976 bln
20.41%
jan 1, 2002
1.057 trl
-10.838 bln
-1.02%
jan 1, 2003
1.104 trl
+46.641 bln
4.41%
jan 1, 2004
1.439 trl
+335.707 bln
30.42%
jan 1, 2005
1.857 trl
+418.033 bln
29.04%
jan 1, 2006
2.226 trl
+368.71 bln
19.85%
jan 1, 2007
2.662 trl
+435.59 bln
19.57%
jan 1, 2008
3.258 trl
+596.61 bln
22.42%
jan 1, 2009
4.086 trl
+828.273 bln
25.42%
jan 1, 2010
3.215 trl
-871.177 bln
-21.32%
jan 1, 2011
4.193 trl
+977.334 bln
30.4%
jan 1, 2012
5.235 trl
+1.043 trl
24.87%
jan 1, 2013
5.495 trl
+259.452 bln
4.96%
jan 1, 2014
5.67 trl
+175.74 bln
3.2%
jan 1, 2015
5.602 trl
-68.36 bln
-1.21%
jan 1, 2016
4.79 trl
-812.277 bln
-14.5%
Ranking of countries by current statistics by years


Comments: