29
/
en
AIzaSyAYiBZKx7MnpbEhh9jyipgxe19OcubqV5w
April 1, 2024
118945
Denmark
DNK
true
2
1
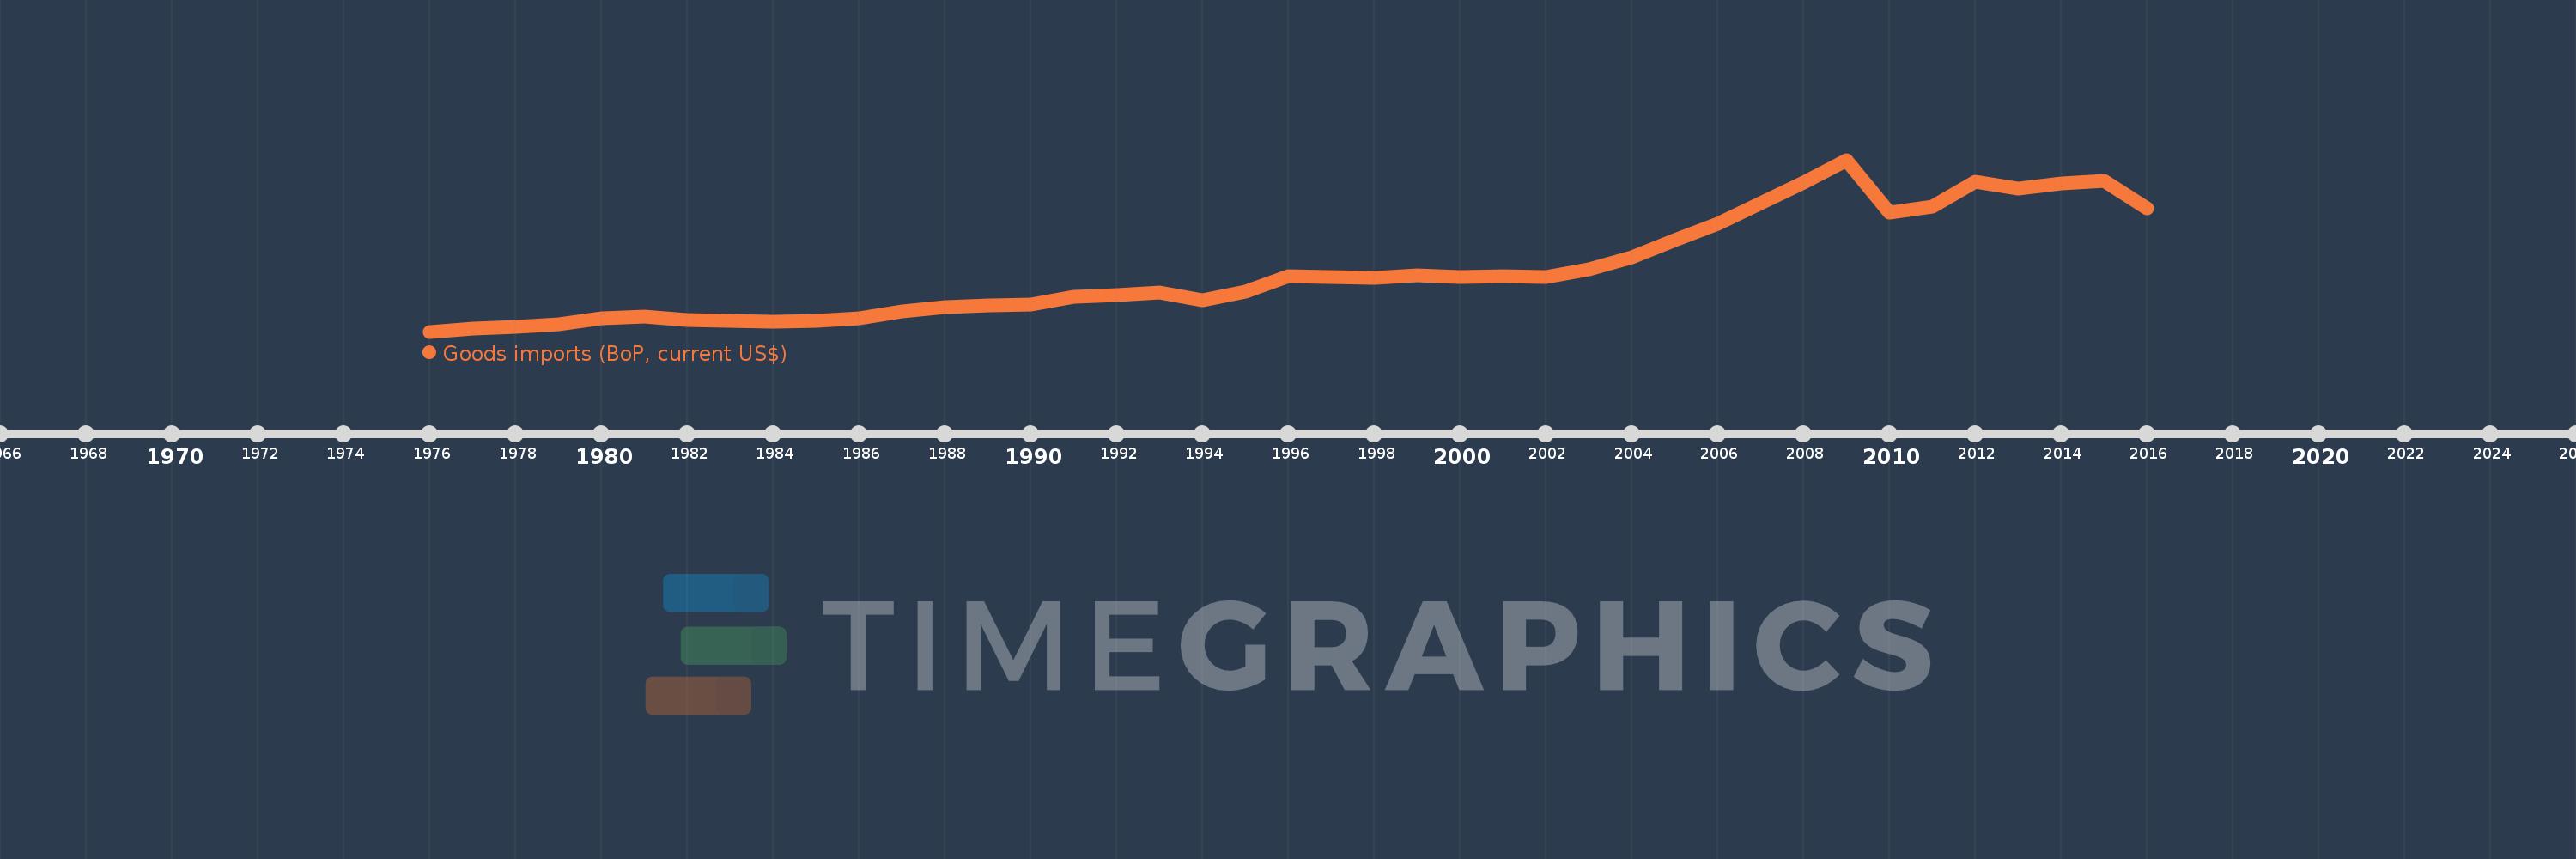
Goods imports (BoP, current US$)
2016,2015,2014,2013,2012,2011,2010,2009,2008,2007,2006,2005,2004,2003,2002,2001,2000,1999,1998,1997,1996,1995,1994,1993,1992,1991,1990,1989,1988,1987,1986,1985,1984,1983,1982,1981,1980,1979,1978,1977,1976
This statistics in other country:
AfghanistanAlbaniaAlgeriaAngolaAntigua and BarbudaArab WorldArgentinaArmeniaArubaAustraliaAustriaAzerbaijanBahamas, TheBahrainBangladeshBarbadosBelarusBelgiumBelizeBeninBermudaBhutanBoliviaBosnia and HerzegovinaBotswanaBrazilBrunei DarussalamBulgariaBurkina FasoBurundiCabo VerdeCambodiaCameroonCanadaCaribbean small statesCentral African RepublicCentral Europe and the BalticsChadChileChinaColombiaComorosCongo, Dem. Rep.Congo, Rep.Costa RicaCote d'IvoireCroatiaCuracaoCyprusCzech RepublicDenmarkDjiboutiDominicaDominican RepublicEarly-demographic dividendEast Asia & PacificEast Asia & Pacific (excluding high income)East Asia & Pacific (IDA & IBRD countries)EcuadorEgypt, Arab Rep.El SalvadorEquatorial GuineaEritreaEstoniaEthiopiaEuro areaEurope & Central AsiaEurope & Central Asia (excluding high income)Europe & Central Asia (IDA & IBRD countries)European UnionFaroe IslandsFijiFinlandFragile and conflict affected situationsFranceFrench PolynesiaGabonGambia, TheGeorgiaGermanyGhanaGreeceGrenadaGuatemalaGuineaGuinea-BissauGuyanaHaitiHeavily indebted poor countries (HIPC)High incomeHondurasHong Kong SAR, ChinaHungaryIBRD onlyIcelandIDA & IBRD totalIDA blendIDA onlyIDA totalIndiaIndonesiaIran, Islamic Rep.IraqIrelandIsraelItalyJamaicaJapanJordanKazakhstanKenyaKiribatiKorea, Rep.KosovoKuwaitKyrgyz RepublicLao PDRLate-demographic dividendLatin America & Caribbean Latin America & Caribbean (excluding high income)Latin America & the Caribbean (IDA & IBRD countries)LatviaLeast developed countries: UN classificationLebanonLesothoLiberiaLibyaLithuaniaLow & middle incomeLow incomeLower middle incomeLuxembourgMacao SAR, ChinaMacedonia, FYRMadagascarMalawiMalaysiaMaldivesMaliMaltaMarshall IslandsMauritaniaMauritiusMexicoMicronesia, Fed. Sts.Middle East & North Africa (excluding high income)Middle East & North Africa (IDA & IBRD countries)Middle incomeMoldovaMongoliaMontenegroMoroccoMozambiqueMyanmarNamibiaNepalNetherlandsNew CaledoniaNew ZealandNicaraguaNigerNigeriaNorth AmericaNorwayOECD membersOmanOther small statesPacific island small statesPakistanPalauPanamaPapua New GuineaParaguayPeruPhilippinesPolandPortugalPost-demographic dividendPre-demographic dividendQatarRomaniaRussian FederationRwandaSamoaSao Tome and PrincipeSaudi ArabiaSenegalSerbiaSeychellesSierra LeoneSingaporeSint Maarten (Dutch part)Slovak RepublicSloveniaSmall statesSolomon IslandsSouth AfricaSouth AsiaSouth Asia (IDA & IBRD)South SudanSpainSri LankaSt. Kitts and NevisSt. LuciaSt. Vincent and the GrenadinesSub-Saharan Africa Sub-Saharan Africa (excluding high income)Sub-Saharan Africa (IDA & IBRD countries)SudanSurinameSwazilandSwedenSwitzerlandSyrian Arab RepublicTajikistanTanzaniaThailandTimor-LesteTogoTongaTrinidad and TobagoTunisiaTurkeyTuvaluUgandaUkraineUnited KingdomUnited StatesUpper middle incomeUruguayVanuatuVenezuela, RBVietnamWest Bank and GazaWorldYemen, Rep.ZambiaZimbabwe Timeline:
This timeline shows a graph from 1976 to 2016 of Denmark. No data until 1975. Number of actual observations by date: 41.
Source name:
World Development Indicators
Source organization:
International Monetary Fund, Balance of Payments Statistics Yearbook and data files.
Categories, topics:
Economy & Growth, Trade
Last updated:
apr 23, 2017
Indicators value changes by year
Minimum:
9.956 bln
jan 1, 1976
Maximum:
114.227 bln
jan 1, 2009
At the date of observation
Value
Absolute change
Change from previous value
jan 1, 1976
9.956 bln
+9.956 bln
0.0%
jan 1, 1977
11.931 bln
+1.974 bln
19.83%
jan 1, 1978
12.725 bln
+794.963 mln
6.66%
jan 1, 1979
14.163 bln
+1.437 bln
11.29%
jan 1, 1980
17.791 bln
+3.629 bln
25.62%
jan 1, 1981
19.126 bln
+1.335 bln
7.5%
jan 1, 1982
17.063 bln
-2.062 bln
-10.78%
jan 1, 1983
16.479 bln
-584.366 mln
-3.42%
jan 1, 1984
15.974 bln
-505.334 mln
-3.07%
jan 1, 1985
16.285 bln
+311.669 mln
1.95%
jan 1, 1986
17.887 bln
+1.602 bln
9.84%
jan 1, 1987
22.357 bln
+4.469 bln
24.99%
jan 1, 1988
24.9 bln
+2.543 bln
11.38%
jan 1, 1989
25.654 bln
+754.393 mln
3.03%
jan 1, 1990
26.304 bln
+649.268 mln
2.53%
jan 1, 1991
31.197 bln
+4.894 bln
18.6%
jan 1, 1992
32.035 bln
+837.501 mln
2.68%
jan 1, 1993
33.446 bln
+1.411 bln
4.41%
jan 1, 1994
29.229 bln
-4.217 bln
-12.61%
jan 1, 1995
34.3 bln
+5.071 bln
17.35%
jan 1, 1996
43.821 bln
+9.521 bln
27.76%
jan 1, 1997
43.203 bln
-618.011 mln
-1.41%
jan 1, 1998
42.734 bln
-468.276 mln
-1.08%
jan 1, 1999
44.021 bln
+1.287 bln
3.01%
jan 1, 2000
43.128 bln
-893.108 mln
-2.03%
jan 1, 2001
43.443 bln
+314.483 mln
0.73%
jan 1, 2002
43.048 bln
-394.401 mln
-0.91%
jan 1, 2003
47.81 bln
+4.762 bln
11.06%
jan 1, 2004
54.84 bln
+7.029 bln
14.7%
jan 1, 2005
65.524 bln
+10.684 bln
19.48%
jan 1, 2006
75.153 bln
+9.629 bln
14.7%
jan 1, 2007
87.684 bln
+12.531 bln
16.67%
jan 1, 2008
100.462 bln
+12.778 bln
14.57%
jan 1, 2009
114.227 bln
+13.765 bln
13.7%
jan 1, 2010
82.126 bln
-32.101 bln
-28.1%
jan 1, 2011
85.905 bln
+3.778 bln
4.6%
jan 1, 2012
101.102 bln
+15.197 bln
17.69%
jan 1, 2013
96.947 bln
-4.155 bln
-4.11%
jan 1, 2014
99.786 bln
+2.838 bln
2.93%
jan 1, 2015
101.343 bln
+1.557 bln
1.56%
jan 1, 2016
84.987 bln
-16.355 bln
-16.14%
Ranking of countries by current statistics by years


Comments: