29
/
en
AIzaSyAYiBZKx7MnpbEhh9jyipgxe19OcubqV5w
April 1, 2024
253058
Sudan
SDN
true
2
1
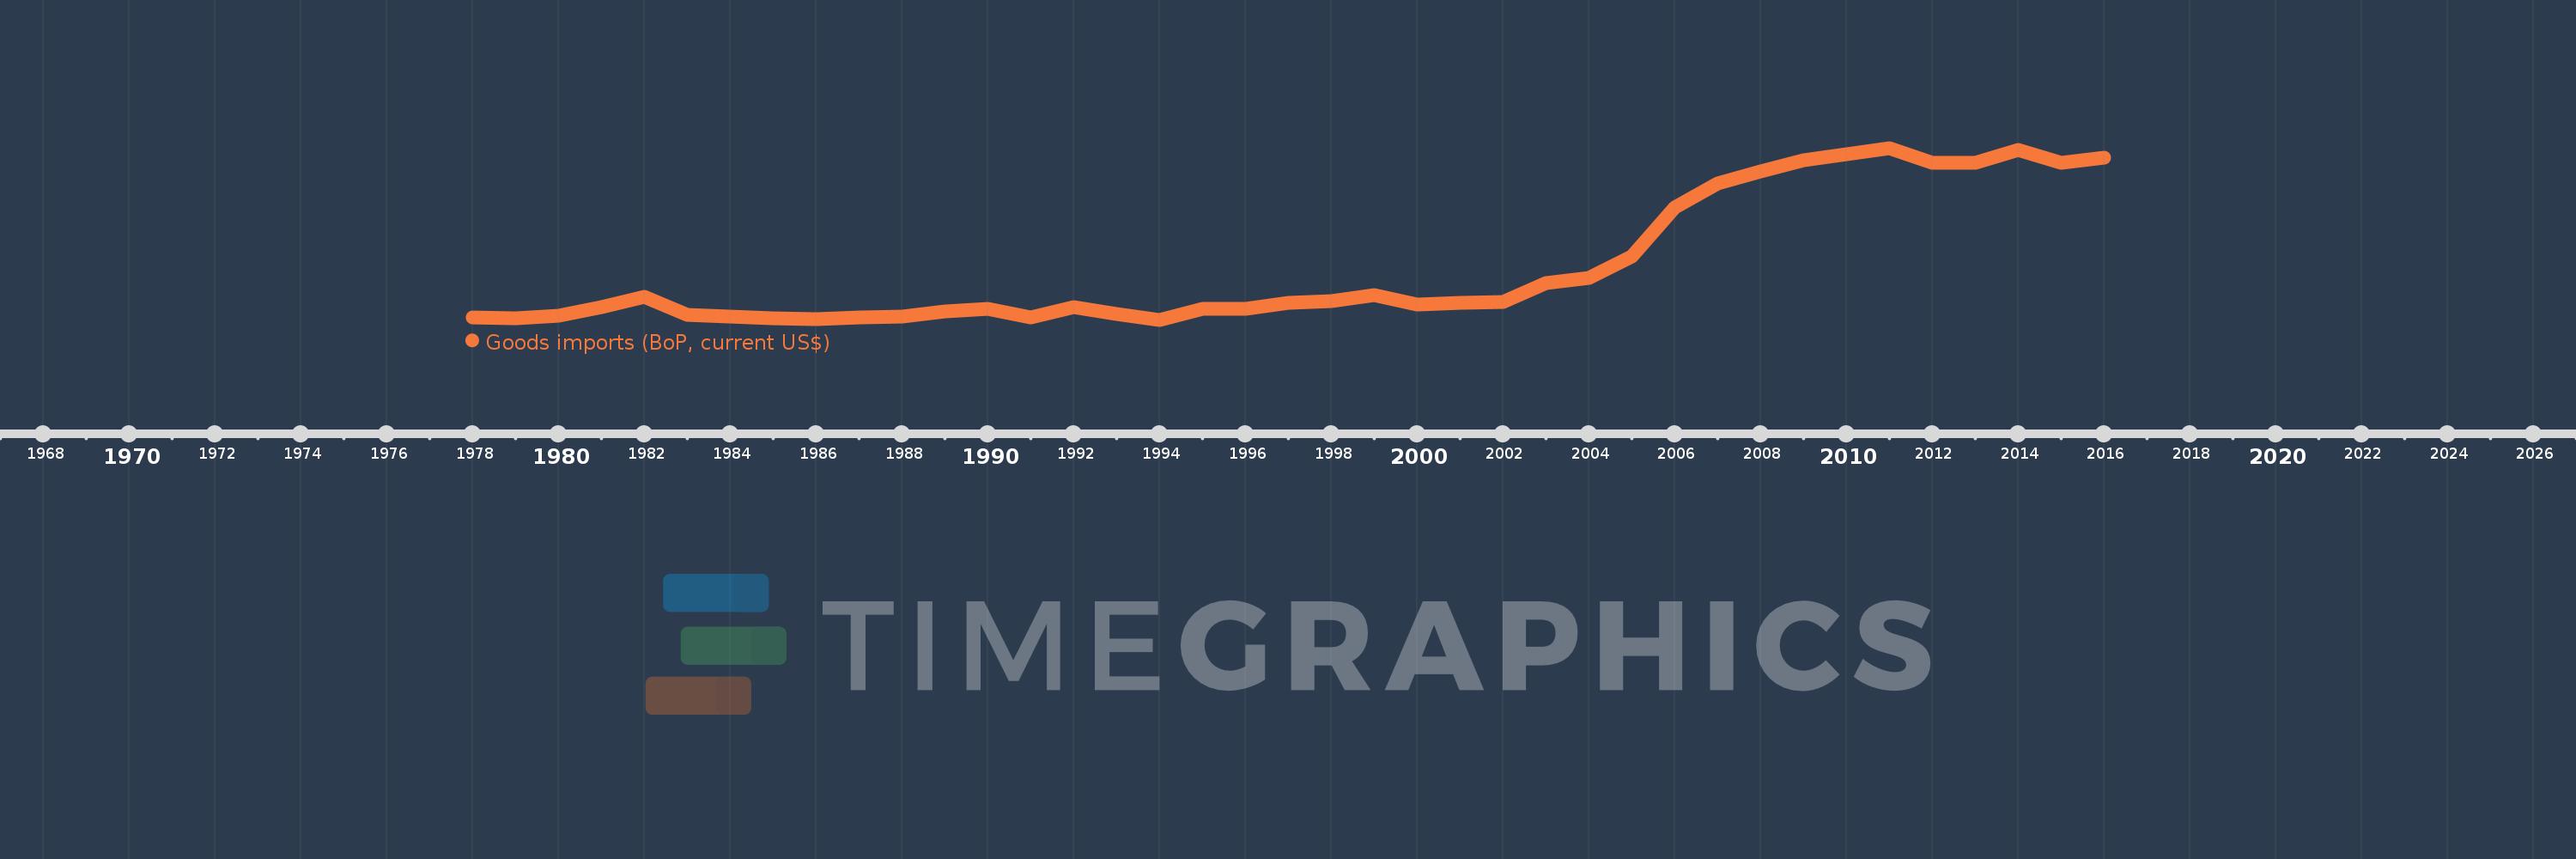
Goods imports (BoP, current US$)
2016,2015,2014,2013,2012,2011,2010,2009,2008,2007,2006,2005,2004,2003,2002,2001,2000,1999,1998,1997,1996,1995,1994,1993,1992,1991,1990,1989,1988,1987,1986,1985,1984,1983,1982,1981,1980,1979,1978
This statistics in other country:
AfghanistanAlbaniaAlgeriaAngolaAntigua and BarbudaArab WorldArgentinaArmeniaArubaAustraliaAustriaAzerbaijanBahamas, TheBahrainBangladeshBarbadosBelarusBelgiumBelizeBeninBermudaBhutanBoliviaBosnia and HerzegovinaBotswanaBrazilBrunei DarussalamBulgariaBurkina FasoBurundiCabo VerdeCambodiaCameroonCanadaCaribbean small statesCentral African RepublicCentral Europe and the BalticsChadChileChinaColombiaComorosCongo, Dem. Rep.Congo, Rep.Costa RicaCote d'IvoireCroatiaCuracaoCyprusCzech RepublicDenmarkDjiboutiDominicaDominican RepublicEarly-demographic dividendEast Asia & PacificEast Asia & Pacific (excluding high income)East Asia & Pacific (IDA & IBRD countries)EcuadorEgypt, Arab Rep.El SalvadorEquatorial GuineaEritreaEstoniaEthiopiaEuro areaEurope & Central AsiaEurope & Central Asia (excluding high income)Europe & Central Asia (IDA & IBRD countries)European UnionFaroe IslandsFijiFinlandFragile and conflict affected situationsFranceFrench PolynesiaGabonGambia, TheGeorgiaGermanyGhanaGreeceGrenadaGuatemalaGuineaGuinea-BissauGuyanaHaitiHeavily indebted poor countries (HIPC)High incomeHondurasHong Kong SAR, ChinaHungaryIBRD onlyIcelandIDA & IBRD totalIDA blendIDA onlyIDA totalIndiaIndonesiaIran, Islamic Rep.IraqIrelandIsraelItalyJamaicaJapanJordanKazakhstanKenyaKiribatiKorea, Rep.KosovoKuwaitKyrgyz RepublicLao PDRLate-demographic dividendLatin America & Caribbean Latin America & Caribbean (excluding high income)Latin America & the Caribbean (IDA & IBRD countries)LatviaLeast developed countries: UN classificationLebanonLesothoLiberiaLibyaLithuaniaLow & middle incomeLow incomeLower middle incomeLuxembourgMacao SAR, ChinaMacedonia, FYRMadagascarMalawiMalaysiaMaldivesMaliMaltaMarshall IslandsMauritaniaMauritiusMexicoMicronesia, Fed. Sts.Middle East & North Africa (excluding high income)Middle East & North Africa (IDA & IBRD countries)Middle incomeMoldovaMongoliaMontenegroMoroccoMozambiqueMyanmarNamibiaNepalNetherlandsNew CaledoniaNew ZealandNicaraguaNigerNigeriaNorth AmericaNorwayOECD membersOmanOther small statesPacific island small statesPakistanPalauPanamaPapua New GuineaParaguayPeruPhilippinesPolandPortugalPost-demographic dividendPre-demographic dividendQatarRomaniaRussian FederationRwandaSamoaSao Tome and PrincipeSaudi ArabiaSenegalSerbiaSeychellesSierra LeoneSingaporeSint Maarten (Dutch part)Slovak RepublicSloveniaSmall statesSolomon IslandsSouth AfricaSouth AsiaSouth Asia (IDA & IBRD)South SudanSpainSri LankaSt. Kitts and NevisSt. LuciaSt. Vincent and the GrenadinesSub-Saharan Africa Sub-Saharan Africa (excluding high income)Sub-Saharan Africa (IDA & IBRD countries)SudanSurinameSwazilandSwedenSwitzerlandSyrian Arab RepublicTajikistanTanzaniaThailandTimor-LesteTogoTongaTrinidad and TobagoTunisiaTurkeyTuvaluUgandaUkraineUnited KingdomUnited StatesUpper middle incomeUruguayVanuatuVenezuela, RBVietnamWest Bank and GazaWorldYemen, Rep.ZambiaZimbabwe Timeline:
This timeline shows a graph from 1978 to 2016 of Sudan. No data until 1977. Number of actual observations by date: 39.
Source name:
World Development Indicators
Source organization:
International Monetary Fund, Balance of Payments Statistics Yearbook and data files.
Categories, topics:
Economy & Growth, Trade
Last updated:
apr 23, 2017
Indicators value changes by year
Minimum:
532.8 mln
jan 1, 1994
Maximum:
8.839 bln
jan 1, 2011
At the date of observation
Value
Absolute change
Change from previous value
jan 1, 1978
644.157 mln
+644.157 mln
0.0%
jan 1, 1979
623.934 mln
-20.223 mln
-3.14%
jan 1, 1980
735.75 mln
+111.816 mln
17.92%
jan 1, 1981
1.127 bln
+391.65 mln
53.23%
jan 1, 1982
1.634 bln
+506.196 mln
44.9%
jan 1, 1983
750.3 mln
-883.296 mln
-54.07%
jan 1, 1984
703.154 mln
-47.146 mln
-6.28%
jan 1, 1985
599.846 mln
-103.308 mln
-14.69%
jan 1, 1986
579.025 mln
-20.821 mln
-3.47%
jan 1, 1987
633.68 mln
+54.655 mln
9.44%
jan 1, 1988
694.751 mln
+61.071 mln
9.64%
jan 1, 1989
948.533 mln
+253.782 mln
36.53%
jan 1, 1990
1.051 bln
+102.467 mln
10.8%
jan 1, 1991
648.8 mln
-402.2 mln
-38.27%
jan 1, 1992
1.138 bln
+489.4 mln
75.43%
jan 1, 1993
810.2 mln
-328.0 mln
-28.82%
jan 1, 1994
532.8 mln
-277.4 mln
-34.24%
jan 1, 1995
1.045 bln
+512.6 mln
96.21%
jan 1, 1996
1.066 bln
+20.6 mln
1.97%
jan 1, 1997
1.339 bln
+273.5 mln
25.66%
jan 1, 1998
1.422 bln
+82.4 mln
6.15%
jan 1, 1999
1.732 bln
+310.3 mln
21.82%
jan 1, 2000
1.256 bln
-476.2 mln
-27.49%
jan 1, 2001
1.366 bln
+110.3 mln
8.78%
jan 1, 2002
1.395 bln
+28.8 mln
2.11%
jan 1, 2003
2.294 bln
+898.73 mln
64.42%
jan 1, 2004
2.536 bln
+242.27 mln
10.56%
jan 1, 2005
3.586 bln
+1.05 bln
41.41%
jan 1, 2006
5.946 bln
+2.36 bln
65.8%
jan 1, 2007
7.105 bln
+1.159 bln
19.49%
jan 1, 2008
7.722 bln
+617.716 mln
8.69%
jan 1, 2009
8.229 bln
+506.955 mln
6.56%
jan 1, 2010
8.528 bln
+298.646 mln
3.63%
jan 1, 2011
8.839 bln
+311.392 mln
3.65%
jan 1, 2012
8.128 bln
-711.84 mln
-8.05%
jan 1, 2013
8.123 bln
-4.877 mln
-0.06%
jan 1, 2014
8.728 bln
+605.22 mln
7.45%
jan 1, 2015
8.106 bln
-621.977 mln
-7.13%
jan 1, 2016
8.368 bln
+261.694 mln
3.23%
Ranking of countries by current statistics by years


Comments: