29
/
en
AIzaSyAYiBZKx7MnpbEhh9jyipgxe19OcubqV5w
April 1, 2024
62623
World
WLD
false
2
1
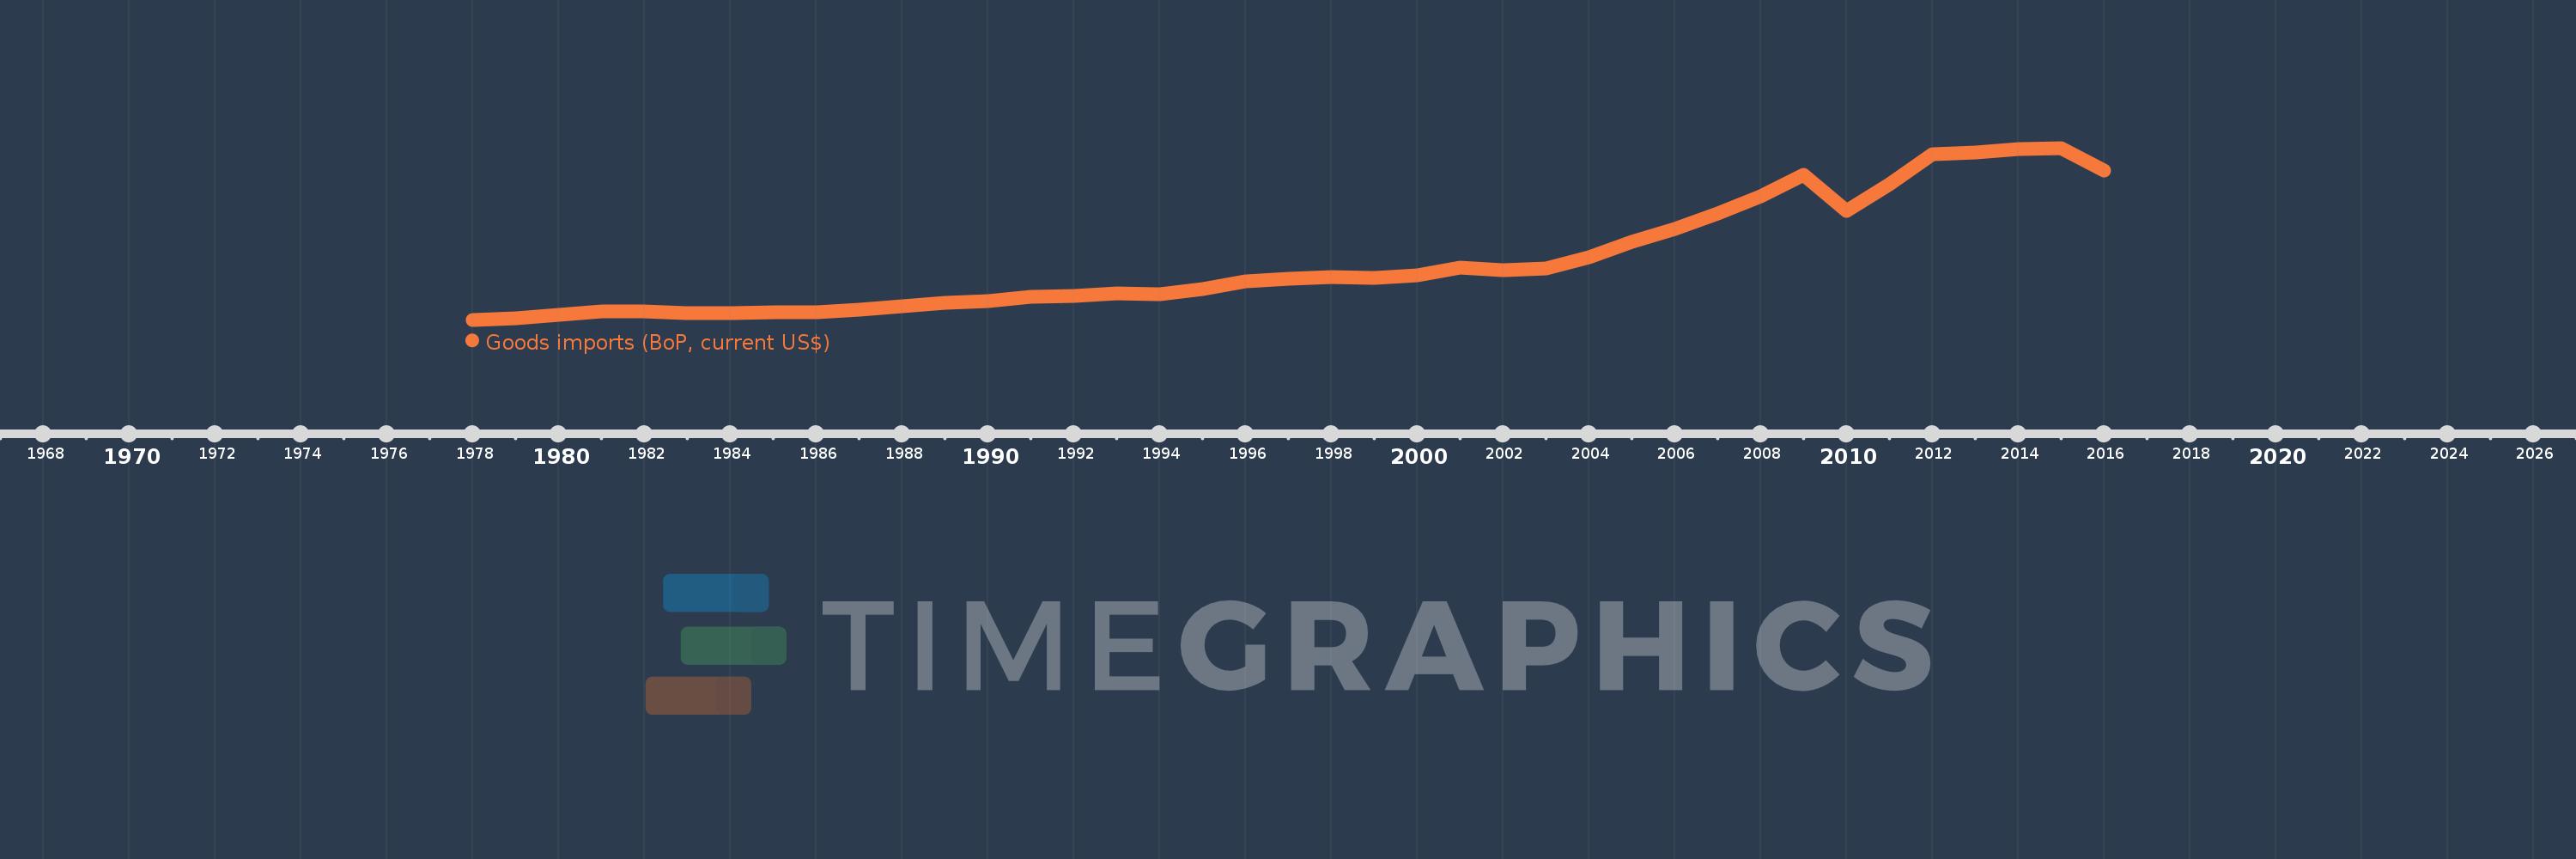
Goods imports (BoP, current US$)
2016,2015,2014,2013,2012,2011,2010,2009,2008,2007,2006,2005,2004,2003,2002,2001,2000,1999,1998,1997,1996,1995,1994,1993,1992,1991,1990,1989,1988,1987,1986,1985,1984,1983,1982,1981,1980,1979,1978
This statistics in other country:
AfghanistanAlbaniaAlgeriaAngolaAntigua and BarbudaArab WorldArgentinaArmeniaArubaAustraliaAustriaAzerbaijanBahamas, TheBahrainBangladeshBarbadosBelarusBelgiumBelizeBeninBermudaBhutanBoliviaBosnia and HerzegovinaBotswanaBrazilBrunei DarussalamBulgariaBurkina FasoBurundiCabo VerdeCambodiaCameroonCanadaCaribbean small statesCentral African RepublicCentral Europe and the BalticsChadChileChinaColombiaComorosCongo, Dem. Rep.Congo, Rep.Costa RicaCote d'IvoireCroatiaCuracaoCyprusCzech RepublicDenmarkDjiboutiDominicaDominican RepublicEarly-demographic dividendEast Asia & PacificEast Asia & Pacific (excluding high income)East Asia & Pacific (IDA & IBRD countries)EcuadorEgypt, Arab Rep.El SalvadorEquatorial GuineaEritreaEstoniaEthiopiaEuro areaEurope & Central AsiaEurope & Central Asia (excluding high income)Europe & Central Asia (IDA & IBRD countries)European UnionFaroe IslandsFijiFinlandFragile and conflict affected situationsFranceFrench PolynesiaGabonGambia, TheGeorgiaGermanyGhanaGreeceGrenadaGuatemalaGuineaGuinea-BissauGuyanaHaitiHeavily indebted poor countries (HIPC)High incomeHondurasHong Kong SAR, ChinaHungaryIBRD onlyIcelandIDA & IBRD totalIDA blendIDA onlyIDA totalIndiaIndonesiaIran, Islamic Rep.IraqIrelandIsraelItalyJamaicaJapanJordanKazakhstanKenyaKiribatiKorea, Rep.KosovoKuwaitKyrgyz RepublicLao PDRLate-demographic dividendLatin America & Caribbean Latin America & Caribbean (excluding high income)Latin America & the Caribbean (IDA & IBRD countries)LatviaLeast developed countries: UN classificationLebanonLesothoLiberiaLibyaLithuaniaLow & middle incomeLow incomeLower middle incomeLuxembourgMacao SAR, ChinaMacedonia, FYRMadagascarMalawiMalaysiaMaldivesMaliMaltaMarshall IslandsMauritaniaMauritiusMexicoMicronesia, Fed. Sts.Middle East & North Africa (excluding high income)Middle East & North Africa (IDA & IBRD countries)Middle incomeMoldovaMongoliaMontenegroMoroccoMozambiqueMyanmarNamibiaNepalNetherlandsNew CaledoniaNew ZealandNicaraguaNigerNigeriaNorth AmericaNorwayOECD membersOmanOther small statesPacific island small statesPakistanPalauPanamaPapua New GuineaParaguayPeruPhilippinesPolandPortugalPost-demographic dividendPre-demographic dividendQatarRomaniaRussian FederationRwandaSamoaSao Tome and PrincipeSaudi ArabiaSenegalSerbiaSeychellesSierra LeoneSingaporeSint Maarten (Dutch part)Slovak RepublicSloveniaSmall statesSolomon IslandsSouth AfricaSouth AsiaSouth Asia (IDA & IBRD)South SudanSpainSri LankaSt. Kitts and NevisSt. LuciaSt. Vincent and the GrenadinesSub-Saharan Africa Sub-Saharan Africa (excluding high income)Sub-Saharan Africa (IDA & IBRD countries)SudanSurinameSwazilandSwedenSwitzerlandSyrian Arab RepublicTajikistanTanzaniaThailandTimor-LesteTogoTongaTrinidad and TobagoTunisiaTurkeyTuvaluUgandaUkraineUnited KingdomUnited StatesUpper middle incomeUruguayVanuatuVenezuela, RBVietnamWest Bank and GazaWorldYemen, Rep.ZambiaZimbabwe Timeline:
This timeline shows a graph from 1978 to 2016 of World. No data until 1977. Number of actual observations by date: 39.
Source name:
World Development Indicators
Source organization:
International Monetary Fund, Balance of Payments Statistics Yearbook and data files.
Categories, topics:
Economy & Growth, Trade
Last updated:
apr 23, 2017
Indicators value changes by year
Minimum:
1.089 trl
jan 1, 1978
Maximum:
18.204 trl
jan 1, 2015
At the date of observation
Value
Absolute change
Change from previous value
jan 1, 1978
1.089 trl
+1.089 trl
0.0%
jan 1, 1979
1.253 trl
+164.65 bln
15.12%
jan 1, 1980
1.582 trl
+328.475 bln
26.21%
jan 1, 1981
1.915 trl
+333.207 bln
21.06%
jan 1, 1982
1.902 trl
-13.127 bln
-0.69%
jan 1, 1983
1.771 trl
-130.548 bln
-6.86%
jan 1, 1984
1.739 trl
-31.901 bln
-1.8%
jan 1, 1985
1.842 trl
+102.6 bln
5.9%
jan 1, 1986
1.867 trl
+25.097 bln
1.36%
jan 1, 1987
2.06 trl
+192.383 bln
10.3%
jan 1, 1988
2.419 trl
+359.966 bln
17.48%
jan 1, 1989
2.747 trl
+327.236 bln
13.52%
jan 1, 1990
2.964 trl
+217.507 bln
7.92%
jan 1, 1991
3.385 trl
+420.646 bln
14.19%
jan 1, 1992
3.483 trl
+98.298 bln
2.9%
jan 1, 1993
3.725 trl
+242.092 bln
6.95%
jan 1, 1994
3.651 trl
-74.62 bln
-2.0%
jan 1, 1995
4.104 trl
+453.346 bln
12.42%
jan 1, 1996
4.914 trl
+809.537 bln
19.73%
jan 1, 1997
5.182 trl
+268.266 bln
5.46%
jan 1, 1998
5.299 trl
+117.277 bln
2.26%
jan 1, 1999
5.27 trl
-28.919 bln
-0.55%
jan 1, 2000
5.498 trl
+227.897 bln
4.32%
jan 1, 2001
6.253 trl
+754.844 bln
13.73%
jan 1, 2002
5.988 trl
-265.223 bln
-4.24%
jan 1, 2003
6.165 trl
+177.638 bln
2.97%
jan 1, 2004
7.271 trl
+1.106 trl
17.94%
jan 1, 2005
8.868 trl
+1.596 trl
21.96%
jan 1, 2006
10.126 trl
+1.259 trl
14.2%
jan 1, 2007
11.648 trl
+1.522 trl
15.03%
jan 1, 2008
13.415 trl
+1.767 trl
15.17%
jan 1, 2009
15.564 trl
+2.149 trl
16.02%
jan 1, 2010
11.944 trl
-3.621 trl
-23.26%
jan 1, 2011
14.586 trl
+2.642 trl
22.12%
jan 1, 2012
17.606 trl
+3.02 trl
20.71%
jan 1, 2013
17.776 trl
+169.971 bln
0.97%
jan 1, 2014
18.079 trl
+302.834 bln
1.7%
jan 1, 2015
18.204 trl
+124.816 bln
0.69%
jan 1, 2016
15.925 trl
-2.279 trl
-12.52%
Ranking of countries by current statistics by years


Comments: