29
/
en
AIzaSyAYiBZKx7MnpbEhh9jyipgxe19OcubqV5w
April 1, 2024
24130
Arab World
ARB
false
2
1
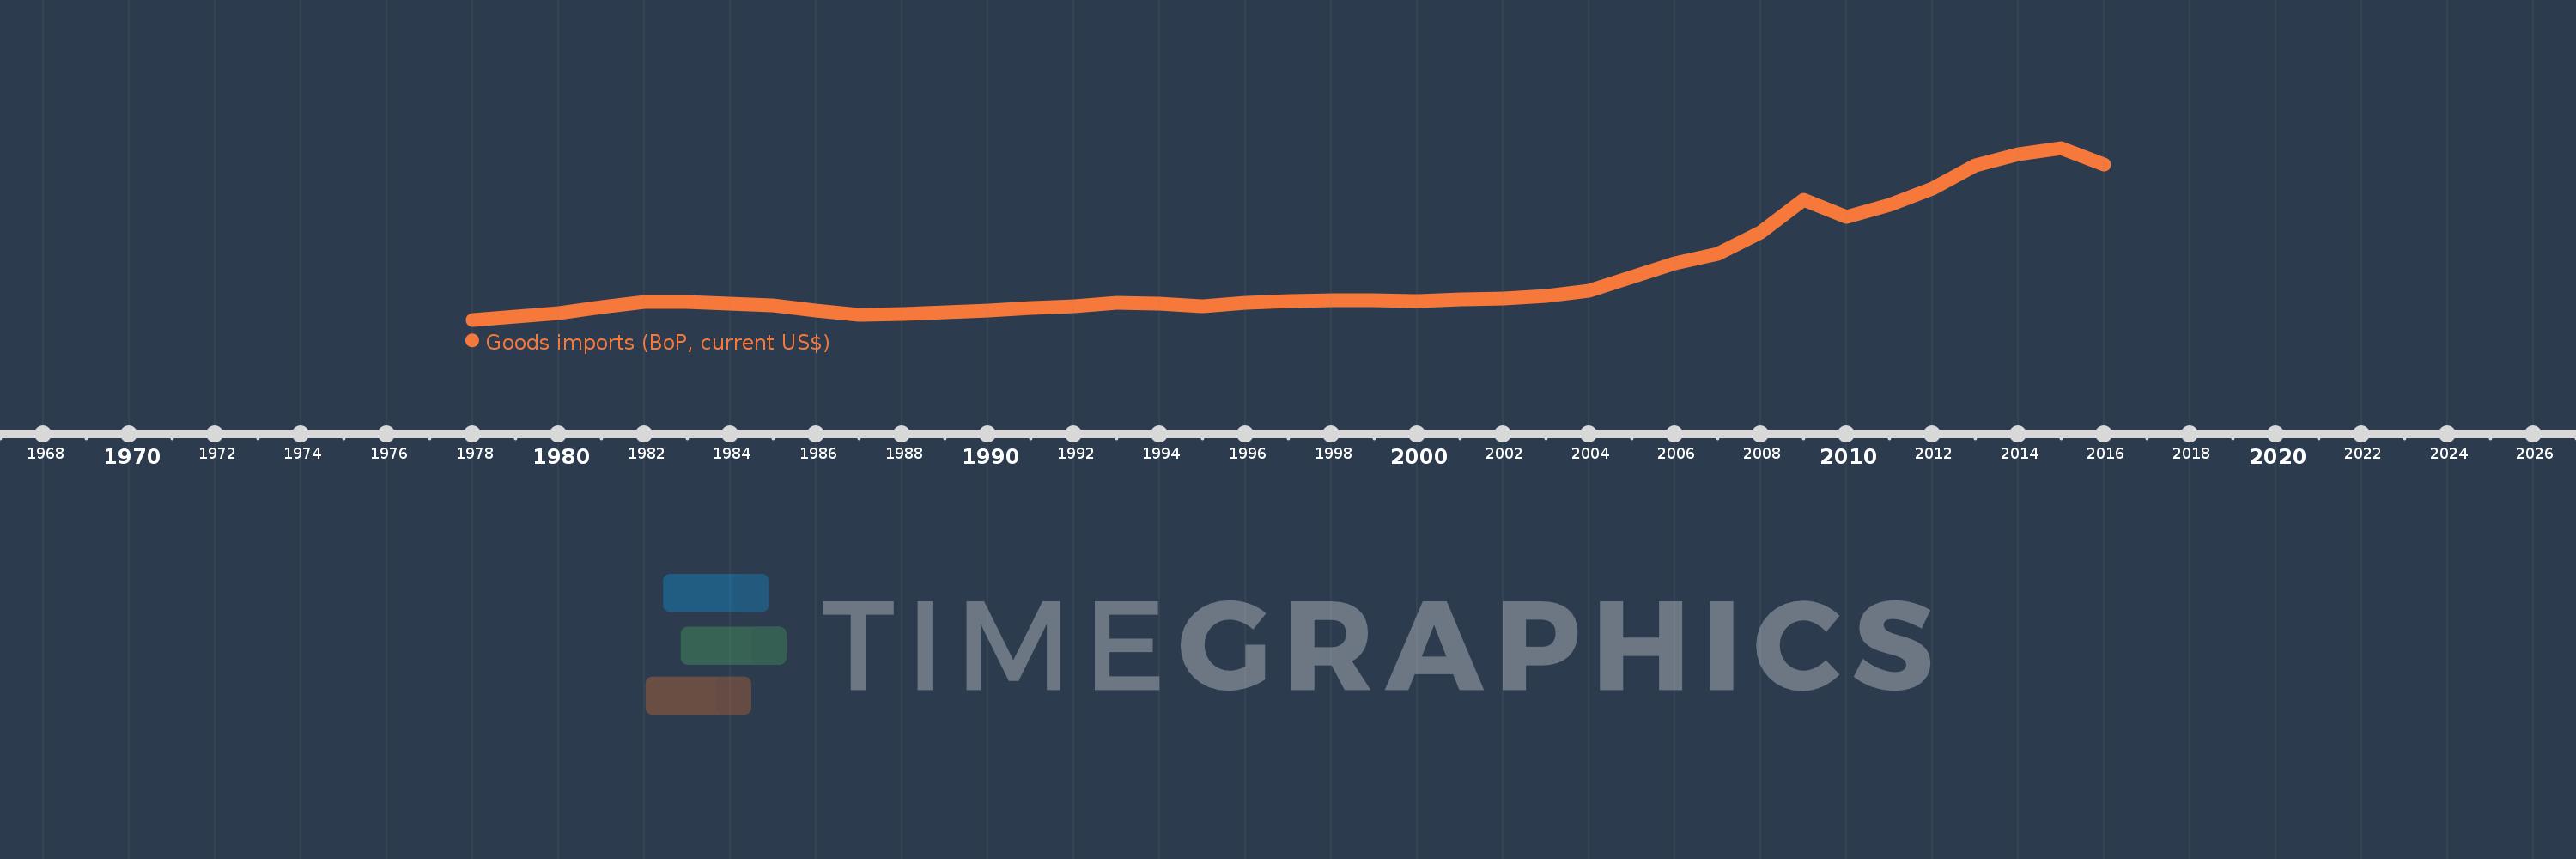
Goods imports (BoP, current US$)
2016,2015,2014,2013,2012,2011,2010,2009,2008,2007,2006,2005,2004,2003,2002,2001,2000,1999,1998,1997,1996,1995,1994,1993,1992,1991,1990,1989,1988,1987,1986,1985,1984,1983,1982,1981,1980,1979,1978
This statistics in other country:
AfghanistanAlbaniaAlgeriaAngolaAntigua and BarbudaArab WorldArgentinaArmeniaArubaAustraliaAustriaAzerbaijanBahamas, TheBahrainBangladeshBarbadosBelarusBelgiumBelizeBeninBermudaBhutanBoliviaBosnia and HerzegovinaBotswanaBrazilBrunei DarussalamBulgariaBurkina FasoBurundiCabo VerdeCambodiaCameroonCanadaCaribbean small statesCentral African RepublicCentral Europe and the BalticsChadChileChinaColombiaComorosCongo, Dem. Rep.Congo, Rep.Costa RicaCote d'IvoireCroatiaCuracaoCyprusCzech RepublicDenmarkDjiboutiDominicaDominican RepublicEarly-demographic dividendEast Asia & PacificEast Asia & Pacific (excluding high income)East Asia & Pacific (IDA & IBRD countries)EcuadorEgypt, Arab Rep.El SalvadorEquatorial GuineaEritreaEstoniaEthiopiaEuro areaEurope & Central AsiaEurope & Central Asia (excluding high income)Europe & Central Asia (IDA & IBRD countries)European UnionFaroe IslandsFijiFinlandFragile and conflict affected situationsFranceFrench PolynesiaGabonGambia, TheGeorgiaGermanyGhanaGreeceGrenadaGuatemalaGuineaGuinea-BissauGuyanaHaitiHeavily indebted poor countries (HIPC)High incomeHondurasHong Kong SAR, ChinaHungaryIBRD onlyIcelandIDA & IBRD totalIDA blendIDA onlyIDA totalIndiaIndonesiaIran, Islamic Rep.IraqIrelandIsraelItalyJamaicaJapanJordanKazakhstanKenyaKiribatiKorea, Rep.KosovoKuwaitKyrgyz RepublicLao PDRLate-demographic dividendLatin America & Caribbean Latin America & Caribbean (excluding high income)Latin America & the Caribbean (IDA & IBRD countries)LatviaLeast developed countries: UN classificationLebanonLesothoLiberiaLibyaLithuaniaLow & middle incomeLow incomeLower middle incomeLuxembourgMacao SAR, ChinaMacedonia, FYRMadagascarMalawiMalaysiaMaldivesMaliMaltaMarshall IslandsMauritaniaMauritiusMexicoMicronesia, Fed. Sts.Middle East & North Africa (excluding high income)Middle East & North Africa (IDA & IBRD countries)Middle incomeMoldovaMongoliaMontenegroMoroccoMozambiqueMyanmarNamibiaNepalNetherlandsNew CaledoniaNew ZealandNicaraguaNigerNigeriaNorth AmericaNorwayOECD membersOmanOther small statesPacific island small statesPakistanPalauPanamaPapua New GuineaParaguayPeruPhilippinesPolandPortugalPost-demographic dividendPre-demographic dividendQatarRomaniaRussian FederationRwandaSamoaSao Tome and PrincipeSaudi ArabiaSenegalSerbiaSeychellesSierra LeoneSingaporeSint Maarten (Dutch part)Slovak RepublicSloveniaSmall statesSolomon IslandsSouth AfricaSouth AsiaSouth Asia (IDA & IBRD)South SudanSpainSri LankaSt. Kitts and NevisSt. LuciaSt. Vincent and the GrenadinesSub-Saharan Africa Sub-Saharan Africa (excluding high income)Sub-Saharan Africa (IDA & IBRD countries)SudanSurinameSwazilandSwedenSwitzerlandSyrian Arab RepublicTajikistanTanzaniaThailandTimor-LesteTogoTongaTrinidad and TobagoTunisiaTurkeyTuvaluUgandaUkraineUnited KingdomUnited StatesUpper middle incomeUruguayVanuatuVenezuela, RBVietnamWest Bank and GazaWorldYemen, Rep.ZambiaZimbabwe Timeline:
This timeline shows a graph from 1978 to 2016 of Arab World. No data until 1977. Number of actual observations by date: 39.
Source name:
World Development Indicators
Source organization:
International Monetary Fund, Balance of Payments Statistics Yearbook and data files.
Categories, topics:
Economy & Growth, Trade
Last updated:
apr 23, 2017
Indicators value changes by year
Minimum:
81.746 bln
jan 1, 1978
Maximum:
835.739 bln
jan 1, 2015
At the date of observation
Value
Absolute change
Change from previous value
jan 1, 1978
81.746 bln
+81.746 bln
0.0%
jan 1, 1979
95.036 bln
+13.29 bln
16.26%
jan 1, 1980
111.145 bln
+16.109 bln
16.95%
jan 1, 1981
137.938 bln
+26.793 bln
24.11%
jan 1, 1982
161.14 bln
+23.202 bln
16.82%
jan 1, 1983
160.604 bln
-535.571 mln
-0.33%
jan 1, 1984
151.683 bln
-8.921 bln
-5.55%
jan 1, 1985
144.714 bln
-6.969 bln
-4.59%
jan 1, 1986
121.274 bln
-23.44 bln
-16.2%
jan 1, 1987
102.08 bln
-19.194 bln
-15.83%
jan 1, 1988
105.332 bln
+3.252 bln
3.19%
jan 1, 1989
115.497 bln
+10.165 bln
9.65%
jan 1, 1990
120.821 bln
+5.324 bln
4.61%
jan 1, 1991
132.064 bln
+11.243 bln
9.31%
jan 1, 1992
140.948 bln
+8.883 bln
6.73%
jan 1, 1993
156.87 bln
+15.922 bln
11.3%
jan 1, 1994
150.591 bln
-6.278 bln
-4.0%
jan 1, 1995
141.649 bln
-8.942 bln
-5.94%
jan 1, 1996
157.427 bln
+15.778 bln
11.14%
jan 1, 1997
165.129 bln
+7.702 bln
4.89%
jan 1, 1998
167.053 bln
+1.924 bln
1.17%
jan 1, 1999
169.193 bln
+2.139 bln
1.28%
jan 1, 2000
163.102 bln
-6.091 bln
-3.6%
jan 1, 2001
171.278 bln
+8.176 bln
5.01%
jan 1, 2002
175.125 bln
+3.847 bln
2.25%
jan 1, 2003
186.443 bln
+11.318 bln
6.46%
jan 1, 2004
208.208 bln
+21.765 bln
11.67%
jan 1, 2005
268.078 bln
+59.87 bln
28.75%
jan 1, 2006
329.997 bln
+61.919 bln
23.1%
jan 1, 2007
370.601 bln
+40.604 bln
12.3%
jan 1, 2008
465.881 bln
+95.28 bln
25.71%
jan 1, 2009
608.124 bln
+142.243 bln
30.53%
jan 1, 2010
534.045 bln
-74.079 bln
-12.18%
jan 1, 2011
585.837 bln
+51.792 bln
9.7%
jan 1, 2012
656.608 bln
+70.772 bln
12.08%
jan 1, 2013
760.229 bln
+103.62 bln
15.78%
jan 1, 2014
808.304 bln
+48.075 bln
6.32%
jan 1, 2015
835.739 bln
+27.435 bln
3.39%
jan 1, 2016
762.513 bln
-73.225 bln
-8.76%
Ranking of countries by current statistics by years


Comments: