29
/
en
AIzaSyAYiBZKx7MnpbEhh9jyipgxe19OcubqV5w
April 1, 2024
179975
Libya
LBY
true
2
1
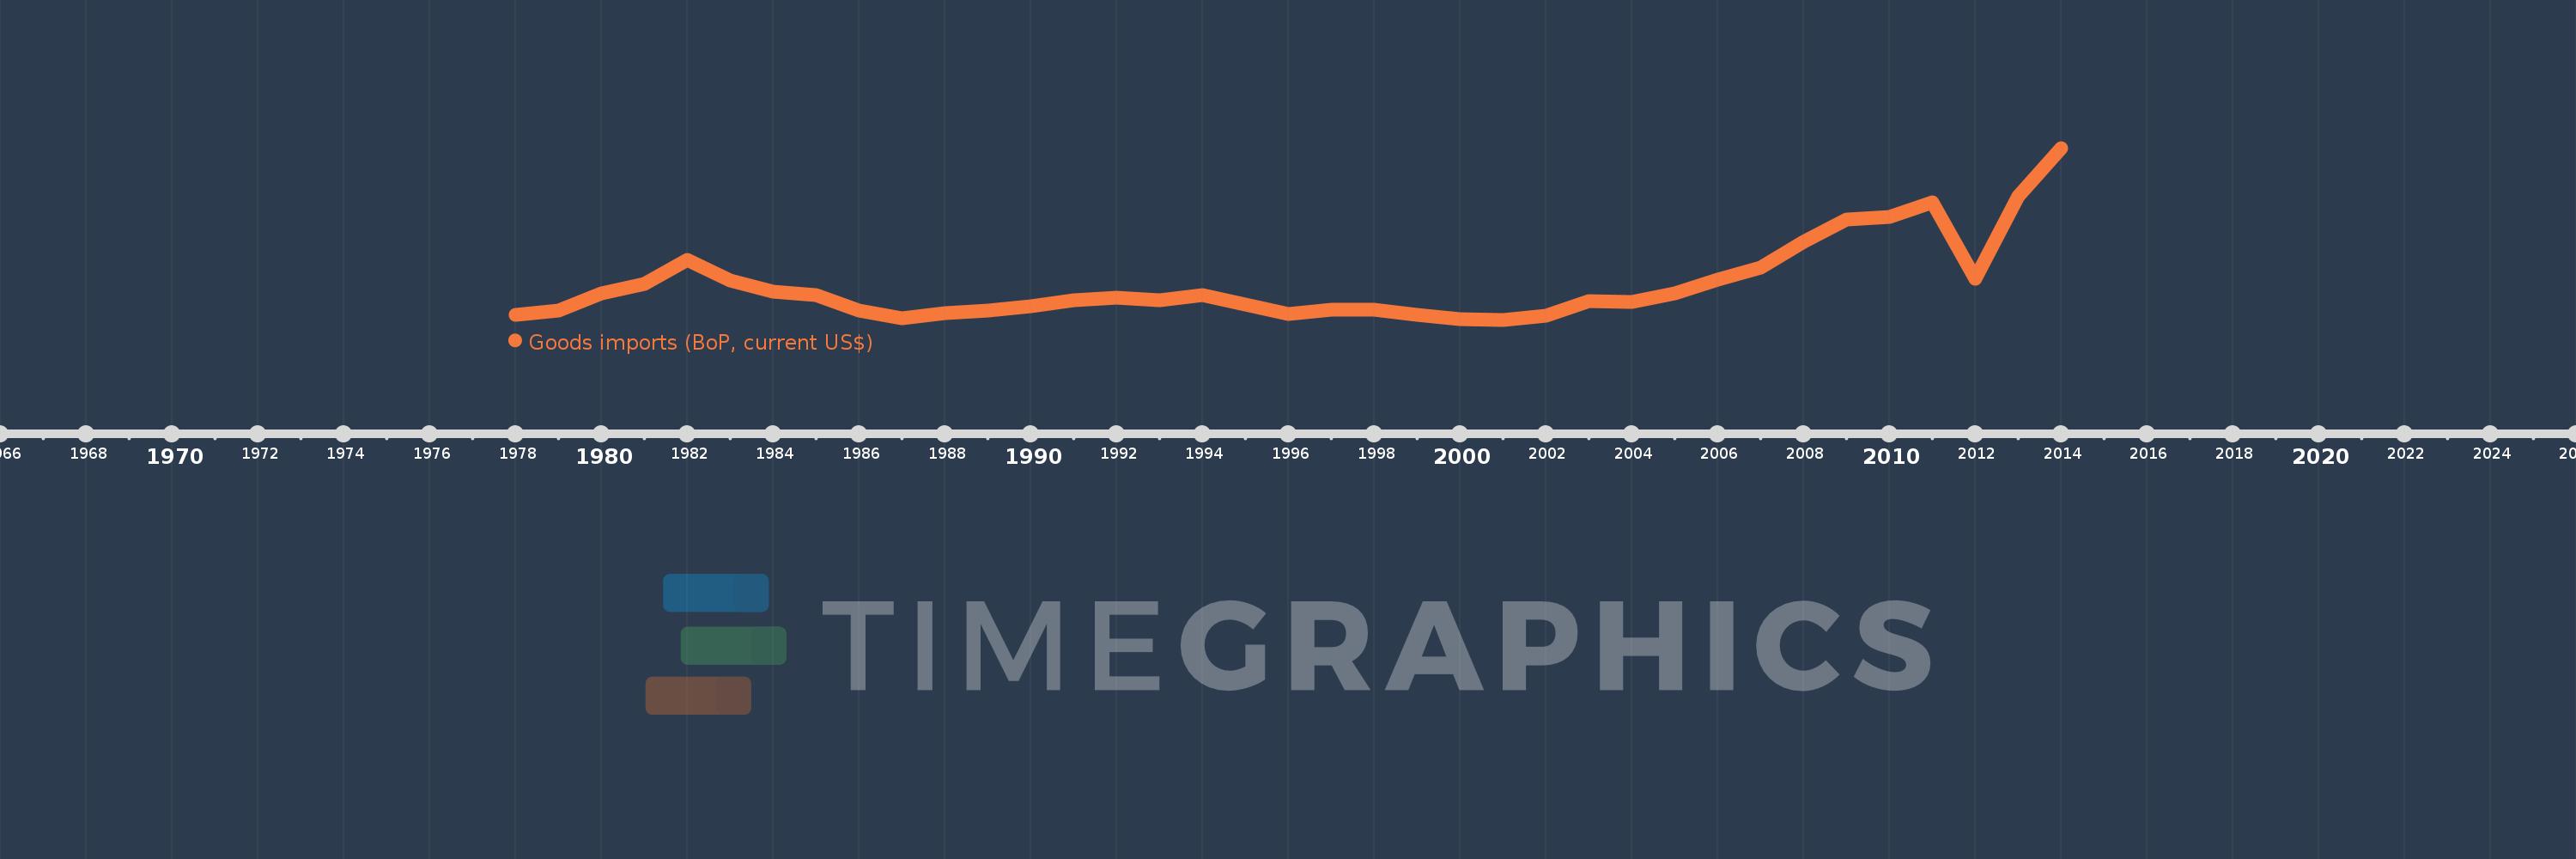
Goods imports (BoP, current US$)
2014,2013,2012,2011,2010,2009,2008,2007,2006,2005,2004,2003,2002,2001,2000,1999,1998,1997,1996,1995,1994,1993,1992,1991,1990,1989,1988,1987,1986,1985,1984,1983,1982,1981,1980,1979,1978
This statistics in other country:
AfghanistanAlbaniaAlgeriaAngolaAntigua and BarbudaArab WorldArgentinaArmeniaArubaAustraliaAustriaAzerbaijanBahamas, TheBahrainBangladeshBarbadosBelarusBelgiumBelizeBeninBermudaBhutanBoliviaBosnia and HerzegovinaBotswanaBrazilBrunei DarussalamBulgariaBurkina FasoBurundiCabo VerdeCambodiaCameroonCanadaCaribbean small statesCentral African RepublicCentral Europe and the BalticsChadChileChinaColombiaComorosCongo, Dem. Rep.Congo, Rep.Costa RicaCote d'IvoireCroatiaCuracaoCyprusCzech RepublicDenmarkDjiboutiDominicaDominican RepublicEarly-demographic dividendEast Asia & PacificEast Asia & Pacific (excluding high income)East Asia & Pacific (IDA & IBRD countries)EcuadorEgypt, Arab Rep.El SalvadorEquatorial GuineaEritreaEstoniaEthiopiaEuro areaEurope & Central AsiaEurope & Central Asia (excluding high income)Europe & Central Asia (IDA & IBRD countries)European UnionFaroe IslandsFijiFinlandFragile and conflict affected situationsFranceFrench PolynesiaGabonGambia, TheGeorgiaGermanyGhanaGreeceGrenadaGuatemalaGuineaGuinea-BissauGuyanaHaitiHeavily indebted poor countries (HIPC)High incomeHondurasHong Kong SAR, ChinaHungaryIBRD onlyIcelandIDA & IBRD totalIDA blendIDA onlyIDA totalIndiaIndonesiaIran, Islamic Rep.IraqIrelandIsraelItalyJamaicaJapanJordanKazakhstanKenyaKiribatiKorea, Rep.KosovoKuwaitKyrgyz RepublicLao PDRLate-demographic dividendLatin America & Caribbean Latin America & Caribbean (excluding high income)Latin America & the Caribbean (IDA & IBRD countries)LatviaLeast developed countries: UN classificationLebanonLesothoLiberiaLibyaLithuaniaLow & middle incomeLow incomeLower middle incomeLuxembourgMacao SAR, ChinaMacedonia, FYRMadagascarMalawiMalaysiaMaldivesMaliMaltaMarshall IslandsMauritaniaMauritiusMexicoMicronesia, Fed. Sts.Middle East & North Africa (excluding high income)Middle East & North Africa (IDA & IBRD countries)Middle incomeMoldovaMongoliaMontenegroMoroccoMozambiqueMyanmarNamibiaNepalNetherlandsNew CaledoniaNew ZealandNicaraguaNigerNigeriaNorth AmericaNorwayOECD membersOmanOther small statesPacific island small statesPakistanPalauPanamaPapua New GuineaParaguayPeruPhilippinesPolandPortugalPost-demographic dividendPre-demographic dividendQatarRomaniaRussian FederationRwandaSamoaSao Tome and PrincipeSaudi ArabiaSenegalSerbiaSeychellesSierra LeoneSingaporeSint Maarten (Dutch part)Slovak RepublicSloveniaSmall statesSolomon IslandsSouth AfricaSouth AsiaSouth Asia (IDA & IBRD)South SudanSpainSri LankaSt. Kitts and NevisSt. LuciaSt. Vincent and the GrenadinesSub-Saharan Africa Sub-Saharan Africa (excluding high income)Sub-Saharan Africa (IDA & IBRD countries)SudanSurinameSwazilandSwedenSwitzerlandSyrian Arab RepublicTajikistanTanzaniaThailandTimor-LesteTogoTongaTrinidad and TobagoTunisiaTurkeyTuvaluUgandaUkraineUnited KingdomUnited StatesUpper middle incomeUruguayVanuatuVenezuela, RBVietnamWest Bank and GazaWorldYemen, Rep.ZambiaZimbabwe Timeline:
This timeline shows a graph from 1978 to 2014 of Libya. No data until 1977. Number of actual observations by date: 37.
Source name:
World Development Indicators
Source organization:
International Monetary Fund, Balance of Payments Statistics Yearbook and data files.
Categories, topics:
Economy & Growth, Trade
Last updated:
apr 23, 2017
Indicators value changes by year
Minimum:
4.129 bln
jan 1, 2001
Maximum:
34.05 bln
jan 1, 2014
At the date of observation
Value
Absolute change
Change from previous value
jan 1, 1978
4.929 bln
+4.929 bln
0.0%
jan 1, 1979
5.764 bln
+834.316 mln
16.93%
jan 1, 1980
8.647 bln
+2.884 bln
50.03%
jan 1, 1981
10.368 bln
+1.721 bln
19.9%
jan 1, 1982
14.563 bln
+4.196 bln
40.47%
jan 1, 1983
10.976 bln
-3.588 bln
-24.63%
jan 1, 1984
8.978 bln
-1.997 bln
-18.2%
jan 1, 1985
8.464 bln
-514.773 mln
-5.73%
jan 1, 1986
5.754 bln
-2.71 bln
-32.02%
jan 1, 1987
4.429 bln
-1.325 bln
-23.03%
jan 1, 1988
5.346 bln
+917.228 mln
20.71%
jan 1, 1989
5.762 bln
+416.104 mln
7.78%
jan 1, 1990
6.509 bln
+746.589 mln
12.96%
jan 1, 1991
7.575 bln
+1.066 bln
16.38%
jan 1, 1992
8.038 bln
+463.258 mln
6.12%
jan 1, 1993
7.545 bln
-493.447 mln
-6.14%
jan 1, 1994
8.431 bln
+886.278 mln
11.75%
jan 1, 1995
6.76 bln
-1.671 bln
-19.82%
jan 1, 1996
5.181 bln
-1.579 bln
-23.36%
jan 1, 1997
5.845 bln
+664.283 mln
12.82%
jan 1, 1998
5.928 bln
+82.969 mln
1.42%
jan 1, 1999
4.93 bln
-997.842 mln
-16.83%
jan 1, 2000
4.302 bln
-627.94 mln
-12.74%
jan 1, 2001
4.129 bln
-172.97 mln
-4.02%
jan 1, 2002
4.825 bln
+696.0 mln
16.86%
jan 1, 2003
7.408 bln
+2.583 bln
53.53%
jan 1, 2004
7.2 bln
-208.0 mln
-2.81%
jan 1, 2005
8.768 bln
+1.568 bln
21.78%
jan 1, 2006
11.174 bln
+2.406 bln
27.44%
jan 1, 2007
13.219 bln
+2.045 bln
18.3%
jan 1, 2008
17.701 bln
+4.482 bln
33.91%
jan 1, 2009
21.658 bln
+3.957 bln
22.35%
jan 1, 2010
22.002 bln
+343.7 mln
1.59%
jan 1, 2011
24.559 bln
+2.557 bln
11.62%
jan 1, 2012
11.2 bln
-13.359 bln
-54.4%
jan 1, 2013
25.59 bln
+14.39 bln
128.48%
jan 1, 2014
34.05 bln
+8.46 bln
33.06%
Ranking of countries by current statistics by years


Comments: